Manual reporting is the invisible time sink that drains productivity across organizations. Analysts spend hours copying data from systems, updating spreadsheets, reformatting charts, and emailing PDFs — work that adds zero analytical value. In 2026, automated reporting powered by AI eliminates this drudgery entirely.
This guide explains how AI-powered automated reporting works, quantifies the time and cost savings, and provides a roadmap for organizations ready to eliminate manual dashboard updates forever.
The True Cost of Manual Reporting
Ask any analyst what percentage of their time goes to “reporting” versus “analysis,” and you’ll hear some version of: 70% reporting, 30% analysis. The 2024 State of Analytics survey by BARC found that data professionals spend an average of 14 hours per week on manual reporting tasks.
For a team of 5 analysts at $75/hour, that’s $273,000 annually spent on repetitive report generation. Multiply that across larger organizations, and manual reporting becomes a multi-million-dollar drag on productivity.
Beyond direct cost, manual reporting creates other problems:
Staleness. By the time you finish compiling a report, the data is already outdated. Weekly reports published on Friday reflect data from Wednesday.
Errors. Manual data handling introduces mistakes. Copy-paste errors, formula breaks, misaligned date ranges, incorrect filters — all compound over time.
Inconsistency. Different analysts format reports differently. Same metric, five different definitions across teams.
Bottlenecks. Decision-makers wait for analysts to generate reports instead of accessing insights on demand.
How AI-Powered Automated Reporting Works
Modern AI analytics platforms like Pulse AI automate the entire reporting workflow:
1. Automated data integration. Instead of manually exporting data from Salesforce, Google Analytics, Stripe, and 10 other tools, the system connects directly to all data sources and syncs automatically.
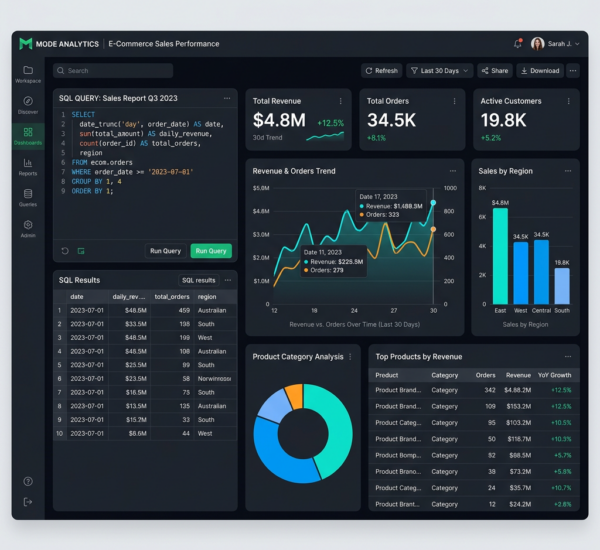
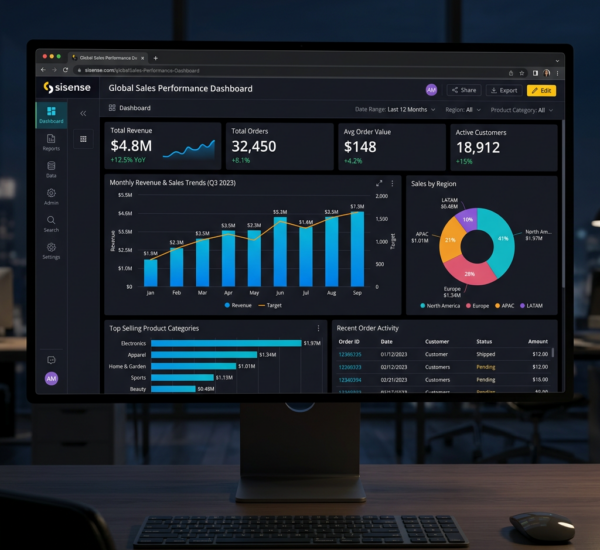
2. Self-updating dashboards. Dashboards refresh in real time or on schedule (hourly, daily, weekly). No manual updates required. The data is always current.
3. Natural language generation. The system writes commentary automatically. “Revenue increased 12% this quarter driven by strong performance in the Enterprise segment” — generated in seconds, not written manually.
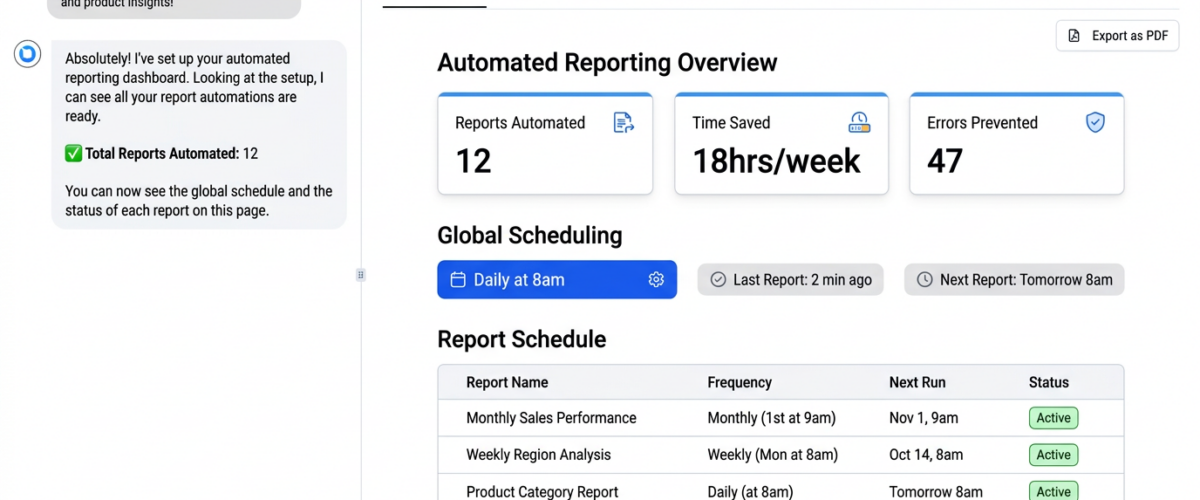
4. Scheduled distribution. Reports email themselves to stakeholders on schedule, formatted for their preferences (PDF, interactive dashboard link, Slack message).
5. Anomaly alerts. Instead of waiting for the weekly report, AI detects significant changes and alerts you immediately. “Customer churn spiked 40% this week” arrives as a push notification.
Real-World Impact: Before and After
Before automation (typical mid-market company):
Monday morning: Analyst pulls raw data from 6 systems into CSV files (1 hour). Loads data into Excel, checks for errors, cleans outliers (1.5 hours). Updates pivot tables and charts (30 minutes). Reformats charts to match brand guidelines (20 minutes). Copies charts into PowerPoint template (20 minutes). Writes bullet point commentary explaining trends (30 minutes). Emails report to 15 stakeholders (10 minutes). Total: 4.5 hours per report.
Weekly reports × 4 analysts = 18 hours per week on a single recurring report. Add ad-hoc requests, board decks, and monthly reviews, and you’re at 25-30 hours per week.
After automation:
Dashboard updates automatically every morning at 8am with current data. Stakeholders open a bookmark and see the latest numbers. Analyst reviews AI-generated commentary for accuracy (10 minutes), adjusts if needed, and the report distributes automatically. Total: 10 minutes per report.
Time savings: 96%. That analyst now has 17.5 hours per week for strategic analysis instead of data wrangling.
Use Case: Monthly Board Report
Manual process: Analyst spends 2 full days building the board deck. Pulls data from 10 sources, builds custom charts, writes executive summary, gets review feedback, makes changes, reformats. Rinse and repeat every month.
Automated process: The board report template auto-populates with current data on the first of each month. AI generates the executive summary highlighting the three most significant changes from last month. Analyst reviews for 30 minutes, adds business context the AI doesn’t know, and publishes. Time savings: 15 hours per month.
One CFO described it: “We went from dreading board report week to barely thinking about it. The system does 90% of the work. We just add the strategic layer.”
Use Case: Daily Sales Performance Report
Manual process: Sales ops pulls yesterday’s data from Salesforce every morning. Updates a shared spreadsheet. Posts a screenshot in Slack. Takes 20-30 minutes daily. 2.5 hours per week.
Automated process: Dashboard updates automatically at 7am with yesterday’s sales data. A Slack bot posts a summary message: “Yesterday’s sales: $47K (+12% vs Tue), 8 deals closed, top performer: Sarah ($12K). View full details: [dashboard link].” Zero manual work.
Use Case: Marketing Campaign Performance
Manual process: Marketing analyst logs into Google Ads, Facebook Ads, LinkedIn Ads, and email platform. Exports metrics for all campaigns. Calculates cost per lead, conversion rates, and ROI in a spreadsheet. Compiles into a weekly report. 3 hours per week.
Automated process: All marketing platforms connect to the AI analytics tool. Campaigns are automatically tracked and scored. Underperforming campaigns trigger alerts. Weekly report generates and distributes automatically. Analyst reviews AI-generated recommendations (15 minutes). Time savings: 2.75 hours per week.
Key Features of Effective Automated Reporting
Multi-source data integration. The system must connect to all your data sources natively. API integrations, not CSV uploads. Real-time or scheduled syncs.
Customizable templates. Pre-built templates for common reports (sales dashboard, marketing performance, financial summary), fully customizable to match your metrics and branding.
Smart scheduling. Reports generate and distribute on any schedule — daily at 8am, weekly on Mondays, monthly on the 1st, quarterly after quarter-close.
Conditional logic. “Only send this report if revenue dropped more than 10%” or “Alert me if any metric changes by more than 20%.” Automated reporting should be smart, not spammy.
Multi-format output. Email PDFs, interactive web dashboards, Slack messages, mobile push notifications — deliver insights in the format stakeholders prefer.
Audit trails. Track who viewed what report, when. Compliance and accountability matter.
How to Implement Automated Reporting
Step 1: Audit current reports. List every recurring report your team produces. Who creates it? How often? How long does it take? Who receives it? This baseline shows where automation delivers the most value.
Step 2: Prioritize by effort × frequency. A weekly report that takes 4 hours is a better automation target than a quarterly report that takes 2 hours. Start with high-frequency, high-effort reports.
Step 3: Map data sources. What systems contain the data for each report? Can your automation platform connect to them? Most modern tools integrate with 100+ common platforms out of the box.
Step 4: Build the template. Define metrics, calculations, visualizations, and formatting. This setup work happens once — then the report runs automatically forever.
Step 5: Test and validate. Run the automated report alongside the manual version for 2-3 cycles. Verify the numbers match. Adjust as needed.
Step 6: Launch and monitor. Cut over to the automated version. Monitor the first few cycles closely to catch any edge cases. After a month, it runs on autopilot.
Common Objections (and Why They’re Wrong)
“Our reporting requirements are too custom for automation.” This was true in 2015. In 2026, AI-powered platforms handle complex custom logic, conditional formatting, and dynamic calculations easily. The real question: is your custom report valuable enough to justify the manual effort, or is it custom because no one ever questioned the requirements?
“Automated reports lack the human touch — the insights and context.” Modern AI generates insightful commentary automatically. It won’t replace a skilled analyst’s strategic interpretation, but it handles 80-90% of routine explanation. The analyst adds the final 10-20% of business context, and the report is better than before in a fraction of the time.
“Our stakeholders prefer Excel.” That’s fine. Automated reporting doesn’t mean abandoning familiar formats. You can auto-generate Excel files and email them on schedule. The point is eliminating the manual work, not forcing new formats.
“Setup time isn’t worth it for a report we only run monthly.” Setup for a typical report takes 1-3 hours with modern platforms. If your monthly report currently takes 4 hours to produce, you break even after 3 months and save 48 hours annually going forward. That math works.
Measuring Success
Time savings. Track hours spent on reporting before and after. Aim for 60-80% reduction.
Timeliness. How fresh is the data when stakeholders see it? Real-time dashboards beat week-old reports.
Consistency. Fewer errors, consistent definitions, standardized formatting across the organization.
Adoption. Are stakeholders actually using the automated reports? High adoption means you’ve replaced manual reporting successfully. Low adoption means the automated version isn’t meeting needs.
Analyst satisfaction. Ask your team: do they feel like report-generating machines or strategic analysts? Automation should shift their work toward higher-value activities.
Beyond Time Savings: Strategic Benefits
The obvious benefit of automated reporting is time savings. The less obvious — but equally valuable — benefits include:
Democratized access to insights. When reports generate automatically and are available on demand, everyone in the organization can access data without waiting for an analyst to run a report. Self-service analytics becomes real.
Faster decision cycles. Real-time dashboards mean decisions happen on current data, not week-old snapshots. This matters in fast-moving markets.
Analyst retention. Talented analysts leave when they feel like Excel jockeys. Automating reporting lets them do the strategic work they signed up for, improving retention.
Scalability. A manual reporting process that works for 20 stakeholders breaks at 200. Automated reporting scales infinitely — adding users costs nothing.
Frequently Asked Questions
What happens when data sources change or business logic updates?
Good automated reporting platforms make updates easy — change a connection, adjust a formula, update the template, and all future reports reflect the change automatically. You’re not locked into the original design. That said, documenting your reporting logic is important so future changes don’t break things unknowingly.
Can automated reporting handle complex calculations and custom metrics?
Yes. Modern platforms support SQL, calculated fields, custom formulas, and even Python/R scripts for advanced calculations. If you can express the logic, the system can automate it. The limitation is usually knowledge of how to build it, not platform capability.
How do you ensure automated reports stay relevant as the business evolves?
Schedule quarterly reviews of all automated reports. Ask stakeholders: is this still useful? Are we tracking the right metrics? Should anything change? Automated reporting is set-it-and-forget-it for execution, but strategy should be reviewed regularly.
What’s the ROI on implementing automated reporting?
For most mid-market companies, automated reporting pays for itself within 2-3 months through time savings alone. A $50K/year platform investment saves $200K+ in analyst time annually. Beyond hard cost savings, faster decisions and better data accessibility create additional value that’s harder to quantify but equally real.