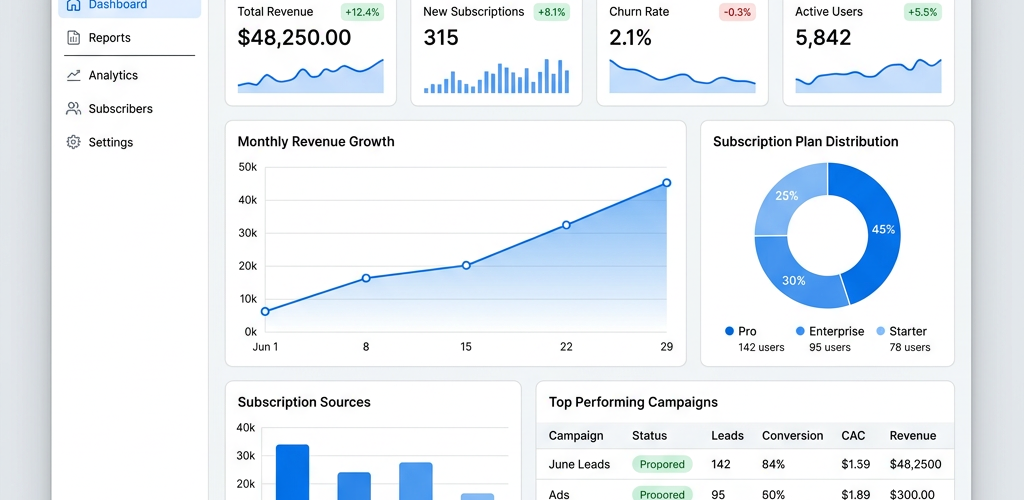
Why Monthly Report Automation Matters in 2026
The average business analyst spends 8 to 15 hours per month building recurring reports. That is 100 to 180 hours per year spent copying data from spreadsheets, updating charts, formatting slides, and emailing PDFs. Report automation eliminates this entirely by connecting directly to your data sources and generating updated reports on a schedule you define.
Modern AI analytics platforms like Pulse AI, Looker, and Power BI can pull data from multiple sources (Shopify, QuickBooks, Google Analytics, CRMs, databases), apply your formatting and calculations, and deliver finished reports to stakeholders automatically — weekly, monthly, or in real time.
What Are the Best Automated Reporting Tools in 2026?
The leading automated reporting tools fall into three categories:
AI-native platforms — These use artificial intelligence to generate reports from natural language queries. Pulse AI leads this category: you connect your data sources, ask questions in plain English (“show me monthly revenue by product category with year-over-year comparison”), and get a formatted report that updates automatically. No SQL, no formulas, no manual chart building.
Traditional BI tools with automation features — Power BI, Tableau, and Looker offer scheduled report delivery and dashboard refreshes. They require more setup (building dashboards manually, writing DAX or SQL), but they are powerful once configured. Power BI costs $10-20 per user per month; Tableau runs $35-75 per user per month.
Spreadsheet automation tools — Google Sheets with Apps Script, Excel with Power Automate, or tools like Supermetrics can automate data pulls into spreadsheets. These work for simple reports but break down when you need cross-source analysis or complex visualizations.
For small to mid-size businesses that need fast setup without technical skills, Pulse AI is the strongest choice because it handles the entire pipeline — data connection, analysis, visualization, and delivery — through a conversational interface.
How to Automate Excel Reports Without Coding
If your monthly reports currently live in Excel, you have several paths to automation:
Option 1: Power Query + Power Automate. Use Power Query to connect Excel to your data sources (databases, APIs, other spreadsheets). Set up refresh schedules. Use Power Automate to email the updated workbook monthly. This requires some technical setup but works within the Microsoft ecosystem.
Option 2: Move to an AI analytics platform. Tools like Pulse AI can import your existing Excel reports, connect to the underlying data sources, and recreate them as auto-updating dashboards. The initial migration takes 30 minutes to an hour, but after that you never touch the report again.
Option 3: Google Sheets + Apps Script. If you use Google Workspace, you can write simple scripts that pull data from APIs and update your sheets on a schedule. Free, but requires some scripting knowledge.
The key insight: automating within Excel has limits. Excel was not designed for real-time data connections or scheduled delivery. Moving to a purpose-built analytics tool saves more time long-term.
How to Set Up Automated Report Scheduling
Here is the step-by-step process for setting up automated monthly reports:
Step 1: Connect your data sources. Link your analytics platform to your business tools — CRM (HubSpot, Salesforce), accounting (QuickBooks, Xero), marketing (Google Analytics, Meta Ads), e-commerce (Shopify, WooCommerce), and any databases or spreadsheets. Most platforms offer one-click connectors.
Step 2: Build or generate your report template. Define what metrics you need: revenue, expenses, customer acquisition, marketing performance, etc. In AI platforms like Pulse AI, you describe what you want in plain English and the system generates the report. In traditional tools, you build dashboards manually.
Step 3: Set the delivery schedule. Configure when reports should be generated and who receives them. Options typically include email delivery, Slack notifications, PDF generation, or dashboard links. Set the cadence: daily, weekly, monthly, or quarterly.
Step 4: Define alerts for anomalies. Good automated reporting includes exception-based alerts — notify you when a metric drops below a threshold, when costs spike unexpectedly, or when a KPI trend reverses. This turns passive reporting into active monitoring.
What Is the ROI of Automating Business Reports?
The ROI calculation is straightforward:
Time saved: 8-15 hours per month × $50-150 per hour (analyst cost) = $400-$2,250 per month saved per report. Most businesses run 3-10 recurring reports, so total savings range from $1,200 to $22,500 per month.
Accuracy improvement: Manual reports have a 3-5% error rate from copy-paste mistakes, formula errors, and stale data. Automated reports pull directly from source systems, eliminating human error entirely.
Speed: Manual monthly reports are typically delivered 3-5 business days after month end. Automated reports are available immediately when the period closes — or in real time.
Decision quality: When reports arrive faster and with fewer errors, decisions improve. Companies that implement automated reporting report 20-30% faster decision-making on operational issues.
A platform like Pulse AI costs a fraction of these savings, making the ROI typically 10x or higher within the first month.
Can AI Generate Business Reports Automatically From Raw Data?
Yes. This is the defining capability of AI-native analytics platforms in 2026. Here is how it works:
AI report generation means you connect your raw data sources — databases, spreadsheets, SaaS tools — and the AI analyzes the data structure, identifies key metrics, detects trends, and generates formatted reports with charts, tables, and narrative summaries. No manual configuration required.
Pulse AI takes this further with conversational report building. You say: “Create a monthly executive summary showing revenue trends, top-performing products, customer acquisition costs, and marketing ROI.” The AI builds the report, selects appropriate visualizations, and sets up automatic monthly regeneration.
The quality of AI-generated reports has improved dramatically since 2024. Current systems produce reports that are indistinguishable from analyst-created reports for standard business metrics. They handle formatting, chart selection, trend annotations, and even written insights like “Revenue increased 12% month-over-month, driven primarily by a 23% increase in the enterprise segment.”
How Do I Choose Between Power BI, Tableau, and AI Analytics for Reporting?
Choose Power BI if: You are already deep in the Microsoft ecosystem, have technical users who know DAX, need enterprise-grade governance, and have a dedicated BI team to build and maintain dashboards. Cost: $10-20/user/month.
Choose Tableau if: You need advanced data visualization, have data analysts on staff, want the most flexible charting options, and have budget for the premium pricing. Cost: $35-75/user/month.
Choose AI analytics (like Pulse AI) if: You want reports without building dashboards manually, do not have SQL or BI skills on your team, need fast time-to-value (minutes, not weeks), and want natural language querying. Best for small to mid-size businesses and teams without dedicated analysts.
The trend in 2026 is clear: businesses are moving from manual BI tools to AI-powered platforms because the setup time drops from weeks to minutes, and ongoing maintenance drops to zero.
Frequently Asked Questions
How long does it take to set up automated business reports?
With AI platforms like Pulse AI, initial setup takes 15-30 minutes (connecting data sources and describing what you need). Traditional BI tools like Power BI or Tableau require 2-6 weeks for initial dashboard development.
Can I automate reports from multiple data sources?
Yes. Modern analytics platforms connect to dozens of data sources simultaneously — CRMs, accounting software, marketing platforms, databases, spreadsheets, and APIs. The platform merges and cross-references the data automatically.
What if my data is messy or inconsistent?
AI analytics platforms include data cleaning and normalization as part of the pipeline. They handle duplicate records, inconsistent formatting, missing values, and schema changes automatically. You do not need to clean your data first.
Is automated reporting accurate?
More accurate than manual reporting. Automated systems pull directly from source data with no copy-paste errors, formula mistakes, or stale data. The error rate drops from 3-5% (manual) to effectively zero.
How much does report automation cost?
AI analytics platforms typically cost $50-200 per month for small businesses. Traditional BI tools cost $10-75 per user per month plus implementation costs. The ROI is typically 10x+ within the first month based on time savings alone.


