You know you should be tracking data. But which data? There are thousands of metrics you could track — revenue by product, customer lifetime value, website bounce rate, email open rates, social media engagement, support ticket volume, inventory turnover. Where do you start?
The answer depends on your business stage, your model, and your goals. But there’s a core set of metrics every business should track, plus stage-specific metrics that matter as you scale. Here’s the complete guide.
The Universal Core: Track These Regardless of Business Type
These metrics matter for every business from $0 to $100M revenue:
Total Revenue (Monthly): The most fundamental metric. Are you growing, shrinking, or flat? Track month-over-month and year-over-year.
Gross Profit Margin: Revenue minus cost of goods sold (COGS), expressed as a percentage. This tells you how much of each dollar you keep after direct costs. Below 50%? You have a unit economics problem.
Cash Balance: How much money you have in the bank right now. More businesses die from running out of cash than from being unprofitable. Track this weekly, not monthly.
Burn Rate (for pre-profitable businesses): How much cash you spend per month. Combined with cash balance, this tells you your runway: how many months until you run out of money if nothing changes.
Customer Acquisition Cost (CAC): Total sales and marketing spend divided by new customers acquired. Tells you how much you’re paying to win each customer.
Customer Churn Rate: Percentage of customers who stop buying from you in a given period. For subscription businesses, this is existential. For transactional businesses, track repeat purchase rate instead.
Startup Stage ($0-$500K Revenue): Focus on Product-Market Fit
At this stage, your goal isn’t sophisticated analytics — it’s proving that people want what you’re selling. Track:
Unit Economics: Can you acquire a customer profitably? If CAC is $100 and average customer lifetime value is $80, you don’t have a business — you have an expensive hobby. Track: Customer Acquisition Cost (CAC), Average Order Value (AOV), Customer Lifetime Value (LTV), LTV:CAC ratio (should be 3:1 or better).
Conversion Metrics: Where are people dropping off in your funnel? Website visitors → Sign-ups/leads → Trial starts (if applicable) → Paying customers. Measure conversion rate at each stage and focus on improving the worst-performing step.
Product Engagement: Are people actually using your product? Daily/weekly active users, Feature usage rate, Time in product, Retention curve (what % of new users are still active after 1 week, 1 month, 3 months).
Best tool for this stage: Pulse AI or a simple spreadsheet. You don’t need enterprise BI yet — you need clarity on a few critical metrics.
Growth Stage ($500K-$5M Revenue): Optimize What’s Working
You’ve proven product-market fit. Now you need to scale efficiently. Add these metrics:
Revenue by Channel/Source: Which acquisition channels are working? Organic search, paid ads, referrals, direct, partnerships? Double down on what works, kill what doesn’t. Track: Revenue by channel, CAC by channel, LTV by channel, Contribution margin by channel (some channels bring cheap customers who churn fast).
Cohort Analysis: Group customers by when they were acquired and track their behavior over time. Are customers acquired in Q1 2026 more valuable than those from Q4 2025? This tells you if your product is improving or if you’re acquiring worse customers over time.
Sales Efficiency: For B2B/sales-driven businesses: Sales pipeline value by stage, Win rate (% of leads that convert), Average deal size, Sales cycle length (days from first contact to close). For self-serve businesses: Conversion rate optimization (landing page performance, checkout flow, upsells).
Operational Efficiency: Order fulfillment time, Inventory turnover, Customer support ticket volume and resolution time, Gross margin by product/service.
Scale Stage ($5M+ Revenue): Build a Data-Driven Culture
At scale, you need metrics for every department, predictive analytics, and cross-functional insights:
Marketing Analytics: Marketing-attributed revenue (which campaigns drove actual sales, not just clicks), Return on ad spend (ROAS) by campaign, Content performance (which blog posts, videos, etc. drive conversions), Brand awareness and consideration metrics.
Sales Analytics (B2B): Sales rep performance (quota attainment, win rate, average deal size), Pipeline health (is it growing fast enough to hit your revenue target?), Forecast accuracy (are your revenue predictions reliable?), Customer segmentation (which customer types have the highest LTV?).
Product Analytics: Feature adoption rates, Product stickiness (DAU/MAU ratio for software products), NPS (Net Promoter Score) trend, Product-led growth metrics (if applicable): PQL (product-qualified leads), trial-to-paid conversion, expansion revenue from existing customers.
Financial Analytics: Operating cash flow, Rule of 40 (for SaaS: revenue growth % + profit margin % should exceed 40), Accounts receivable aging (are customers paying on time?), Unit economics by customer segment.
Metrics by Business Model
E-commerce
Total revenue and revenue growth rate, Average order value (AOV), Conversion rate, Cart abandonment rate, Revenue by product/category, Customer acquisition cost by channel, Customer lifetime value, Repeat purchase rate, Return rate and return reasons, Inventory turnover.
SaaS/Subscription
Monthly Recurring Revenue (MRR), MRR growth rate, Customer churn rate (monthly and annual), Revenue churn rate (includes downgrades/expansion), Net revenue retention (should be >100%), Customer acquisition cost (CAC), LTV:CAC ratio (should be >3), Payback period (months to recover CAC), Free trial to paid conversion rate, Daily/weekly active users.
Service Business
Revenue by service type, Gross margin by client/project, Billable utilization rate (% of employee time that’s billable), Average project value, Project profitability, Sales pipeline by stage, Win rate, Customer satisfaction score (CSAT or NPS), Client retention rate, Revenue per employee.
Marketplace
Gross Merchandise Value (GMV), Take rate (% of GMV you keep as revenue), Supply-side metrics (number of sellers, listings, inventory), Demand-side metrics (buyers, transactions, repeat purchase rate), Liquidity (what % of listings result in a transaction?), CAC for buyers and sellers separately, Retention rates for both sides of the marketplace.
How to Actually Start Tracking
Don’t try to track everything at once. Here’s the practical path:
Week 1: Identify your top 5 metrics. Based on your business stage and model, what are the 5 numbers that matter most? For most early-stage businesses: revenue, gross margin, cash balance, CAC, and customer churn/retention rate.
Week 2: Set up data collection. If you’re not already tracking these metrics, set up the infrastructure: Connect your revenue source (e-commerce platform, payment processor, accounting software) to an analytics tool like Pulse AI. Tag marketing campaigns so you can track CAC by channel. Ensure your systems are recording customer data consistently.
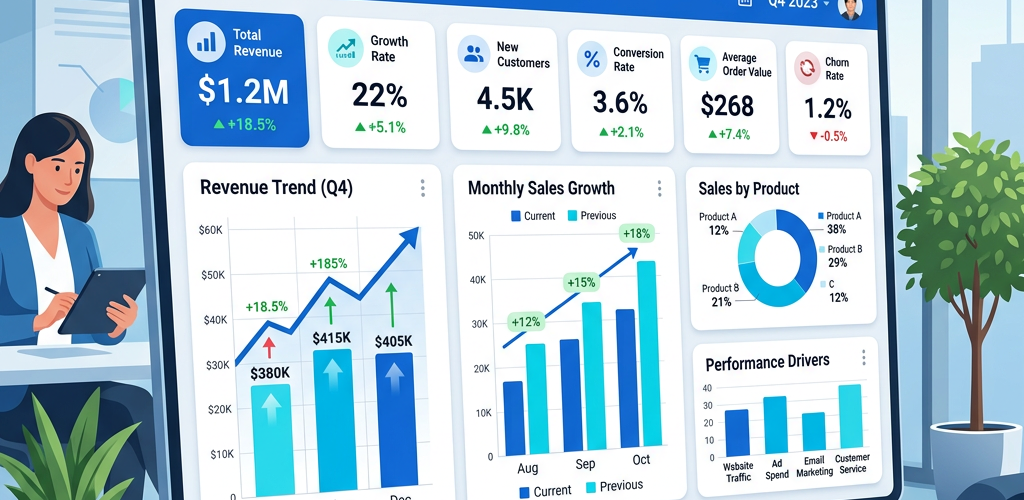
Week 3: Build your first dashboard. Don’t overthink it. Just visualize your top 5 metrics in one place so you can see them at a glance. Set date ranges to show current month vs. previous month, and current year vs. previous year.
Week 4: Start a weekly metrics review. Every Monday morning (or whatever day works for you), spend 15 minutes reviewing your dashboard: What changed this week? Why did it change? Do we need to do anything about it?
Month 2+: Add metrics gradually. Once your core 5 metrics are reliably tracked and regularly reviewed, add 2-3 more. Then 2-3 more the next month. Build your analytics infrastructure incrementally, not all at once.
Common Mistakes to Avoid
Vanity metrics: Metrics that look impressive but don’t impact business outcomes. Social media followers, app downloads, page views — these are fine to track, but they’re not core business health indicators. Focus on metrics tied to revenue and profitability.
Too many dashboards: If you have 15 different dashboards, nobody looks at any of them. One comprehensive business overview dashboard is better than a dozen specialized ones. Add focused dashboards only when specific teams need them.
Not acting on insights: Tracking metrics is pointless if you don’t change behavior based on what they tell you. The goal isn’t data collection — it’s data-driven decision-making.
Tracking without context: A metric without comparison is meaningless. $50K revenue could be amazing or terrible depending on whether it’s up or down from last month. Always show trends and comparisons.
Frequently Asked Questions
How many metrics should I track?
Start with 5-8 core metrics. At scale, you might track 30-50 across all departments, but any one person should focus on 10-15 max. Too many metrics dilute focus.
How often should I review my metrics?
Core business health metrics (revenue, cash, churn): weekly. Operational metrics (marketing campaign performance, sales pipeline): daily to weekly. Strategic metrics (customer lifetime value, unit economics): monthly to quarterly.
What if I can’t calculate some of these metrics?
Start with what you can measure now, and improve your data collection over time. If you don’t have reliable customer lifetime value data yet, estimate it based on average order value and average purchase frequency. Imperfect data you have is better than perfect data you’re waiting to collect.
Do I need different metrics for different team members?
Yes. Your CFO cares about cash flow and margins. Your head of marketing cares about CAC and conversion rates. Your product manager cares about feature usage and engagement. Build role-specific dashboards, but ensure everyone sees the top-line business metrics (revenue, growth, profitability) so everyone understands the business as a whole.


