You are spending money on marketing — Google Ads, Facebook, LinkedIn, content, email — and the clicks are coming in. But when you look at your revenue, the math does not add up. Leads are not converting, campaigns that should work based on industry benchmarks are falling flat, and you cannot figure out why. The answer is almost always hidden in your data, if you know where to look.
Here is how to use data analytics to diagnose conversion problems and fix them systematically instead of guessing.
The Four Places Conversions Break Down
Traffic quality problem. You are getting clicks, but the people clicking are not your target customer. This shows up as high bounce rates, low time on site, and visitors who never move past the first page. Data tells you which channels send the wrong traffic.
Messaging mismatch. Your ad promises one thing, your landing page says something different, and your product delivers a third thing. Visitors feel the disconnect and leave. Analytics can show you where in the funnel people drop off most dramatically.
Friction in the conversion process. Your form is too long, your checkout has too many steps, your pricing is unclear. Each point of friction loses a percentage of potential customers. Data reveals exactly which step loses the most people.
Post-click experience failure. Your ad and landing page are fine, but your product, support, or follow-up process fails to deliver. This shows up as trial signups that never activate, purchases that get refunded, or leads that go cold after the first interaction.
How to Use Data to Diagnose the Problem
Map your full funnel. Use AI analytics tools like Pulse AI to connect your marketing data (Google Ads, Facebook Ads), website analytics (Google Analytics), and CRM data. You need to see the complete journey from ad click to revenue, not just pieces of it.
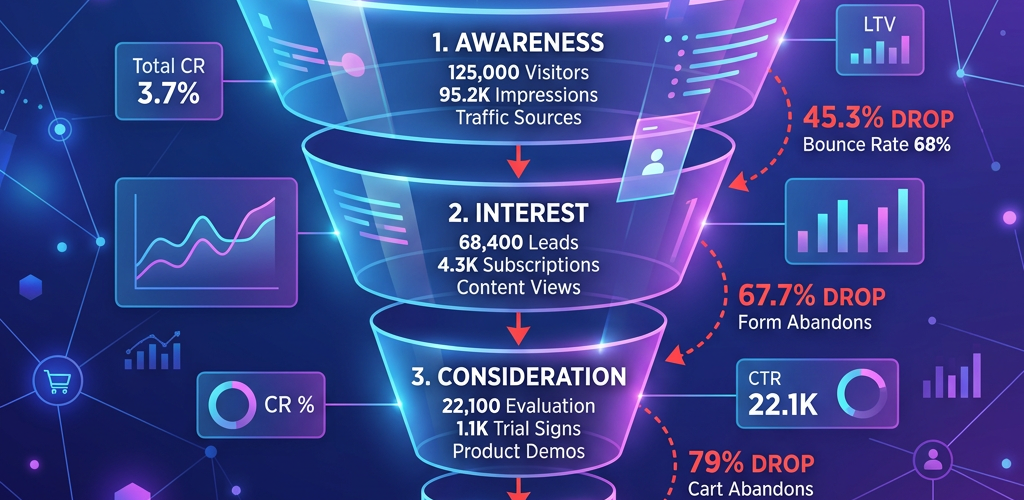
Calculate conversion rates at each step. Break your funnel into stages: ad click → landing page visit → lead capture → qualified lead → trial/demo → paying customer. Calculate the conversion rate between each stage. The stage with the lowest conversion rate is your biggest problem.
Segment by source. Not all traffic converts equally. Compare conversion rates by channel, campaign, ad creative, and keyword. You might find that LinkedIn ads convert at 12% while Google Display ads convert at 2% — even though Google brings more volume. This tells you where to shift budget.
Analyze time lags. Many businesses kill campaigns too early because they do not account for the time between first touch and purchase. B2B software might have a 45-day sales cycle. E-commerce might see most purchases within 7 days. Knowing your lag time prevents premature optimization.
The Most Common Data-Driven Fixes
Pause low-converting channels and double down on winners. Most businesses spread their budget too thin. If you are running six marketing channels and two account for 80% of your profitable conversions, cut the other four and reinvest in the winners. AI analytics makes this obvious by showing cost per acquisition and ROI by channel.
Fix messaging mismatches. If your data shows a specific campaign has high click-through rates but terrible conversion rates, the messaging is probably misaligned. The ad promises something the landing page does not deliver. Match the headline, offer, and imagery exactly between ad and landing page.
Reduce form fields. Every additional form field costs you conversions. Analytics can show you how many people start a form but abandon it. A/B test shorter versions. Moving from 8 fields to 4 fields can double form completion rates.
Target high-intent keywords and audiences. If your conversion rate is consistently low across campaigns, you might be targeting too broad. Data shows which search terms and audience segments actually convert. Narrow your targeting to match.
Using AI to Automate Conversion Optimization
AI analytics platforms like Pulse AI can identify conversion problems automatically. Instead of manually analyzing every campaign, the AI flags anomalies — “Your Facebook campaign conversion rate dropped 40% last week” — and suggests root causes based on pattern analysis.
AI can also predict which leads are most likely to convert based on behavioral signals, allowing you to prioritize follow-up. If a lead visited your pricing page three times and downloaded a case study, the AI scores them as high-intent and alerts your sales team.
Real Example: Fixing a Conversion Problem With Data
A SaaS company was spending $15,000/month on Google Ads with a 2.1% conversion rate from click to trial signup. Industry benchmark was 5-8%. They connected their data to Pulse AI and asked “Why is my Google Ads conversion rate so low?”
The AI revealed that 60% of clicks came from one keyword group targeting “free [product category]” searches. These visitors wanted free tools, not paid software. Conversion rate for that group: 0.3%. Conversion rate for other keywords: 6.8%.
They paused the free-seeking keyword group, reallocated budget to high-intent commercial keywords, and conversion rate jumped to 7.2% within two weeks. Same budget, 3x more trial signups, because data showed exactly where the problem was.
Frequently Asked Questions
What is a good conversion rate for marketing campaigns?
It depends entirely on your industry, price point, and what you are converting to. B2B software trials convert at 2-5% from ad click. E-commerce product pages convert at 1-3%. Lead magnets convert at 10-25%. The absolute number matters less than whether you are improving over time and whether your cost per acquisition is profitable.
How long should I run a campaign before deciding it is not working?
Collect at least 100-200 conversions or run for at least 2-4 weeks before making major decisions. Shorter cycles are too noisy. AI tools can help by analyzing statistical significance — telling you when a difference is real vs. random variation.
Can AI really tell me why my campaigns are not converting?
AI cannot read minds, but it can identify patterns humans miss. It spots that your Monday ads convert better than Friday ads, that mobile traffic converts 50% worse than desktop, or that visitors from LinkedIn stay 3x longer than visitors from Facebook. These patterns point to root causes you can then test and fix.