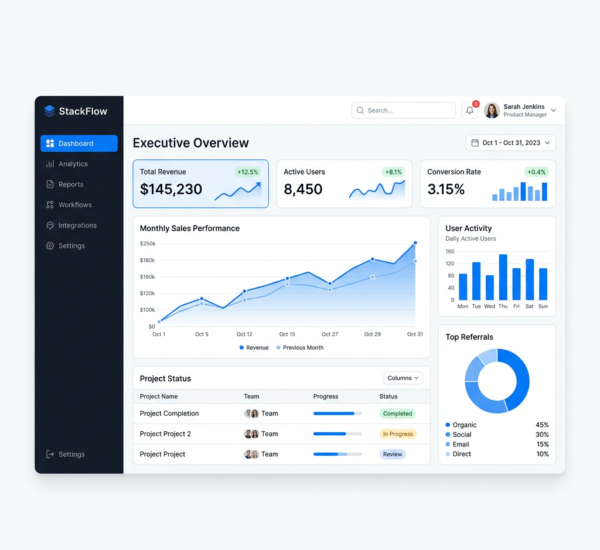
You are running a startup. Your time is split between building product, talking to customers, fundraising, hiring, and putting out fires. You know you should be tracking metrics — revenue, user growth, burn rate, conversion rates — but hiring a data analyst is not in the budget, and learning SQL is not happening this quarter. So how do you actually track the metrics that matter without a data team?
The answer in 2026 is straightforward: AI-powered analytics platforms built specifically for non-technical founders. Here is exactly how to set up startup metrics tracking in under an hour, with zero data expertise required.
The Core Metrics Every Startup Should Track
Revenue and growth rate. Track monthly recurring revenue (MRR) for SaaS, total revenue for other models. More importantly, track the month-over-month growth rate. A $50K revenue month means nothing without context — are you growing 10% monthly or declining 5%? AI tools like Pulse AI calculate growth rates automatically and flag when they change.
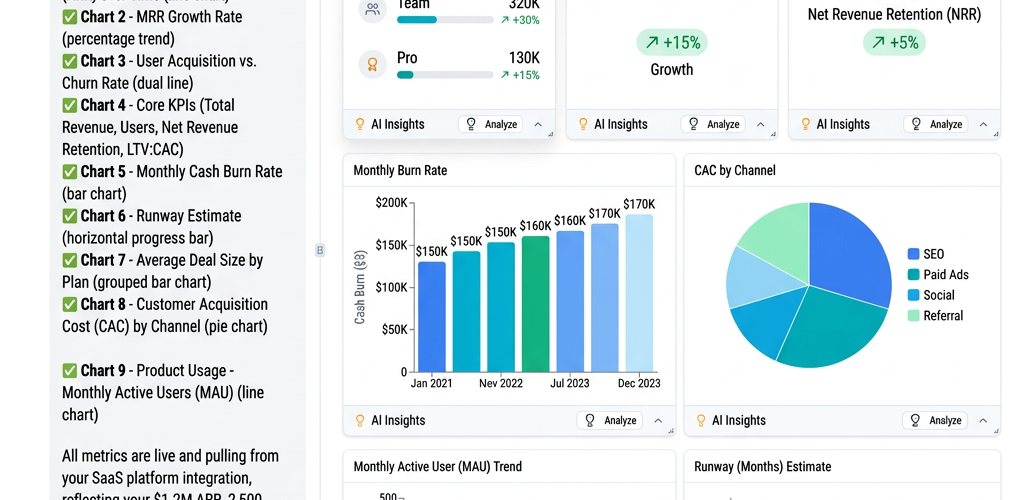
Burn rate and runway. How much cash are you spending per month, and how many months until you run out? This is existential for startups. Connect your bank account or accounting software to an analytics platform and it calculates runway automatically, updating daily.
Customer acquisition cost (CAC). Total marketing and sales spend divided by new customers acquired. If you spend $10,000 on ads and get 50 customers, your CAC is $200. Track this monthly to see if acquisition is getting cheaper or more expensive as you scale.
Customer lifetime value (LTV). Average revenue per customer over their entire relationship with you. For subscription businesses, this is average monthly revenue per customer divided by monthly churn rate. For transaction businesses, it is average order value times purchase frequency over a defined period.
LTV:CAC ratio. Your lifetime value should be at least 3x your acquisition cost for a healthy business. Below 3:1 means unit economics are broken. Above 5:1 means you should probably be spending more on growth.
Churn rate. The percentage of customers who leave each month. A 5% monthly churn rate means you lose half your customers every 14 months. High churn makes growth nearly impossible because you are constantly refilling a leaky bucket.
User engagement or activation metrics. For product-led businesses, track what percentage of signups actually use the product (activation rate) and how often active users engage (daily/weekly/monthly active users).
How to Set This Up Without a Data Team
Step 1: Choose an AI analytics platform designed for non-technical users. Pulse AI, Metabase, and similar tools let you connect data sources with a few clicks and generate dashboards automatically. No SQL, no data modeling, no technical setup required.
Step 2: Connect your core data sources. For most startups, this means your payment processor (Stripe, PayPal), your product database or CRM (HubSpot, Salesforce), and your marketing tools (Google Ads, Facebook Ads). Modern platforms have native integrations — you authorize access and data starts flowing.
Step 3: Use AI to build your metrics dashboard. With tools like Pulse AI, you describe what you want to track in plain English: “Show me monthly revenue, growth rate, burn rate, and customer count.” The AI generates the dashboard automatically. You refine from there.
Step 4: Set up automated alerts. Configure notifications for critical thresholds: runway drops below 6 months, churn rate increases by more than 20%, revenue growth rate turns negative. This ensures you catch problems without constantly checking dashboards.
Step 5: Schedule investor or board reports. Most AI analytics tools can email a metrics summary on a schedule — weekly to your team, monthly to investors or advisors. This eliminates the hours founders spend compiling board decks.
Tools Specifically Built for Startup Metrics
Pulse AI is designed for founders without data teams. Natural language querying, automatic dashboard generation, and built-in startup metric templates. Connect Stripe and your CRM, and you have an investor-ready dashboard in under 15 minutes. Best for early-stage startups that want fast setup with zero technical complexity.
ChartMogul is purpose-built for SaaS subscription metrics (MRR, churn, LTV, cohort analysis). Strong if your entire business model is subscriptions. Less flexible for other startup types.
Baremetrics is another SaaS-specific tool that connects to Stripe and displays subscription metrics automatically. Very fast setup but limited to SaaS models.
Google Sheets + Zapier is the DIY approach. Use Zapier to pipe data from tools into a Google Sheet, then build charts manually. Free but time-intensive and breaks easily.
Frequently Asked Questions
Do I really need to track metrics this early?
Yes. The earlier you start, the more historical data you have when it matters — when fundraising, when deciding to pivot, when hiring. Startups that track metrics from day one make faster, better decisions than those that fly blind for the first year.
What if my data is in spreadsheets?
Most AI analytics tools accept CSV uploads or connect directly to Google Sheets. You do not need a database. Your spreadsheets are a perfectly valid data source.
How much does startup metrics tracking cost?
Tools like Pulse AI start well under $100/month for early-stage startups. Specialized SaaS tools like ChartMogul and Baremetrics cost $50-$200/month depending on MRR. This is a fraction of one day of developer time — a clear ROI even for bootstrapped startups.