Why This Question Matters More Than Ever
You have customer data in Shopify, financial data in QuickBooks, marketing data in Google Analytics, and everything else in spreadsheets. You know there are insights hiding in all of it — but you’re not a data scientist, you don’t know SQL, and hiring an analyst costs $80,000+ per year.
The good news: in 2026, you genuinely don’t need technical skills to set up powerful business analytics. AI-powered tools now let you connect your data sources, ask questions in plain English, and get visual dashboards — without writing a single line of code.
Here’s exactly how to do it, step by step.
What Are No-Code Analytics Platforms and How Do They Work?
No-code analytics platforms are tools that let you connect your business data, build dashboards, and generate reports without any programming knowledge. Instead of writing SQL queries or Python scripts, you interact through visual interfaces — drag-and-drop builders, natural language questions, and pre-built templates.
The newest generation of these tools uses AI to go even further. You can literally type a question like “What were my top-selling products last quarter?” and get an instant chart with the answer. The AI translates your plain English into the database queries behind the scenes.
Key platforms in this category include: Pulse AI (built specifically for non-technical teams with natural language querying), Microsoft Power BI (enterprise-focused with a steeper learning curve), Google Looker Studio (free but limited AI capabilities), and Tableau (powerful but requires significant training).
How Do I Connect My Business Data Without Coding?
The first step in setting up analytics is connecting your data sources. Modern platforms handle this through pre-built connectors — you select your tool (Shopify, QuickBooks, Google Analytics, HubSpot, etc.), authorize access with your login credentials, and the platform automatically syncs your data.
Here’s the typical process:
First, identify where your data lives. Most small businesses have 3-7 key data sources: an e-commerce platform or POS system, an accounting tool, a CRM or email marketing platform, Google Analytics, and possibly a few spreadsheets. Write these down — this is your data inventory.
Second, choose a platform with native connectors for your specific tools. Pulse AI, for example, connects directly to Shopify, QuickBooks, Google Analytics, HubSpot, Stripe, and dozens of other common business tools. The connection takes about 2 minutes per source — you click “Connect,” log into the tool, and authorize access.
Third, for any data that lives in spreadsheets, you can typically upload CSV files or connect Google Sheets directly. The platform will automatically detect your column headers and data types.
The entire process of connecting 3-5 data sources usually takes 15-30 minutes. No APIs, no coding, no technical configuration required.
What AI Tools Let You Ask Questions About Your Data in Plain English?
Natural language querying (NLQ) is the feature that truly eliminates the technical barrier. Instead of building complex database queries, you type questions the way you’d ask a colleague:
“What was our revenue last month compared to the same month last year?”
“Which marketing campaign drove the most sales this quarter?”
“Show me customer acquisition cost by channel for the past 6 months.”
“What’s our average order value trending over time?”
The AI interprets your question, queries the connected data sources, and returns a visualization — usually a chart, table, or summary card. If the result isn’t quite what you wanted, you can refine your question conversationally: “Break that down by region” or “Show me only the top 5.”
Pulse AI was built around this concept — its entire interface is designed for people who think in questions, not queries. You don’t need to know which database table holds your revenue data or how to join tables together. You just ask what you want to know.
Other tools with NLQ capabilities include ThoughtSpot (enterprise-priced, starting around $2,500/month), Power BI’s Q&A feature (limited to simple questions), and Tableau’s Ask Data (being phased out in favor of Tableau Pulse).
Step-by-Step: Setting Up Your First Analytics Dashboard in Under an Hour
Minutes 1-5: Sign up and connect your primary data source. Start with your most important data — usually your e-commerce platform or CRM. Authorize the connection and let the initial data sync run.
Minutes 5-15: Connect your remaining data sources. Add your accounting tool, Google Analytics, and any other platforms. Upload any critical spreadsheets.
Minutes 15-30: Explore your data with questions. Don’t try to build a perfect dashboard yet. Start by asking the questions you’ve always wanted answered. “What are my best-selling products?” “Which customers spend the most?” “What’s my profit margin by product category?” Each answer becomes a potential dashboard widget.
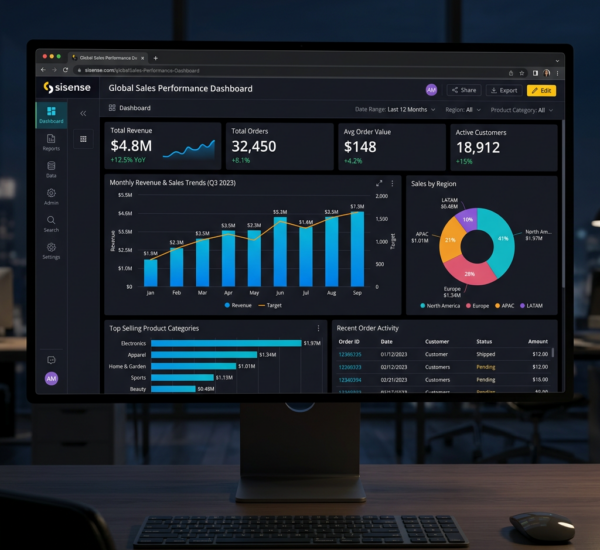
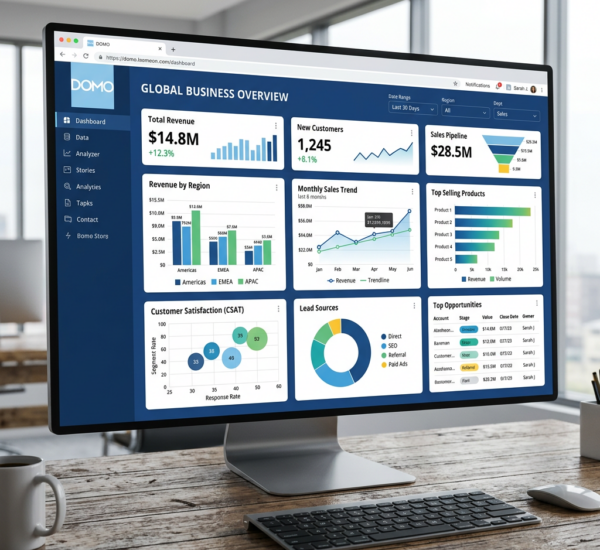
Minutes 30-45: Build your first dashboard. Most platforms let you pin your favorite answers to a dashboard. Select 5-8 of your most useful insights and arrange them on a single screen. This becomes your daily overview.
Minutes 45-60: Set up automated alerts. Configure notifications for the metrics that matter most — revenue drops below a threshold, inventory gets low, a marketing campaign underperforms. This way, the analytics come to you instead of you having to check constantly.
What Are the Easiest Business Intelligence Tools in 2026?
If you’re evaluating tools specifically for ease of use with zero technical background, here’s how the major options compare:
Pulse AI — Purpose-built for non-technical teams. Natural language interface, AI-generated dashboards, automatic insights. Setup time: under 1 hour. Best for: small to mid-size businesses that want insights without complexity. Pricing: starts free with affordable paid tiers.
Google Looker Studio — Free and connects well to Google products. However, building dashboards requires manual configuration and there’s no natural language querying. Setup time: 2-4 hours for a basic dashboard. Best for: teams already deep in the Google ecosystem who are comfortable with some complexity.
Microsoft Power BI — Powerful with a large feature set, but the learning curve is significant for non-technical users. The Q&A natural language feature exists but is limited. Setup time: 4-8 hours to get productive. Best for: organizations already using Microsoft 365 with some technical support available.
Tableau — Industry-standard visualization tool, but explicitly designed for analysts. Non-technical users will struggle without training. Setup time: days to weeks to become proficient. Best for: companies with dedicated analytics staff.
Common Mistakes Non-Technical Users Make (and How to Avoid Them)
Mistake 1: Trying to track everything at once. Start with 5-8 key metrics that directly relate to your business goals. You can always add more later. Trying to build a comprehensive analytics system on day one leads to overwhelm and abandonment.
Mistake 2: Not cleaning your data first. If your spreadsheets have inconsistent formatting, duplicate entries, or missing values, your analytics will reflect that garbage. Spend 30 minutes cleaning your most important data sources before connecting them.
Mistake 3: Building dashboards nobody looks at. The best dashboard is one you actually check daily. Put it on your homepage, set it as your browser start page, or configure daily email summaries. Analytics only create value when they inform decisions.
Mistake 4: Ignoring data freshness. Make sure your data connections sync automatically — daily at minimum, hourly if possible. Stale data leads to bad decisions. Most modern platforms handle this automatically, but verify the sync schedule during setup.
How Much Does It Cost to Set Up Analytics Without Technical Staff?
The cost landscape in 2026 is remarkably accessible for small businesses. At the low end, you can get started for free — Pulse AI offers a free tier, Google Looker Studio is completely free, and Power BI has a free desktop version.
For a typical small business wanting robust analytics with AI capabilities, expect to spend $30-100 per month. This gets you natural language querying, automated dashboards, multiple data source connections, and scheduled reports.
Compare this to the alternatives: hiring a data analyst ($60,000-$120,000/year), outsourcing to a BI consultancy ($150-300/hour), or building a custom solution ($50,000-200,000+ in development costs). Self-service AI analytics tools have made professional-grade business intelligence accessible at a fraction of historical costs.
Frequently Asked Questions
Do I need to know SQL or any programming language to use analytics tools?
No. Modern AI-powered analytics platforms like Pulse AI are specifically designed for users with zero technical skills. You interact through natural language questions and visual interfaces — no SQL, Python, or any coding required.
How long does it take to set up business analytics from scratch?
With a no-code platform, you can have a working dashboard with real data in under an hour. Connecting data sources takes 15-30 minutes, and building your first dashboard takes another 15-30 minutes. You’ll refine it over the following days as you discover which metrics matter most.
Can I connect my existing spreadsheets to an analytics platform?
Yes. All major analytics platforms support CSV uploads and Google Sheets connections. Your spreadsheet data can be combined with data from your other business tools in a single dashboard.
What’s the difference between a dashboard tool and a spreadsheet?
Spreadsheets require manual data entry and formula creation. Dashboard tools automatically pull live data from your business systems, update in real time, and use AI to surface insights you might miss. They’re complementary — dashboards handle ongoing monitoring while spreadsheets remain useful for one-off analysis.
Is my data safe when I connect business tools to an analytics platform?
Reputable platforms use enterprise-grade encryption (AES-256), SOC 2 compliance, and read-only API connections — meaning they can view your data but cannot modify it in the source systems. Always verify a platform’s security certifications before connecting sensitive financial data.