What Is the Difference Between Data, Information, and Actionable Insights?
Data is raw numbers and facts: “427 website visitors yesterday,” “$23,450 in revenue this month,” “customer support received 89 tickets.” Data alone tells you nothing.
Information is data with context: “Website traffic is up 15% from last month,” “Revenue is 8% below target,” “Support tickets increased 30% after the product update.” Information describes what happened.
Actionable insights are conclusions that lead to specific decisions: “Traffic increased 15% but conversion rate dropped 20%, meaning the new ad campaign is bringing lower-quality visitors — pause the campaign and reallocate budget to the high-converting channels,” or “Support tickets spiked because of a specific bug in the checkout flow — fix it to recover the 12% of abandoned carts.”
The gap between data and actionable insights is where most businesses get stuck. They have plenty of data but no system for extracting meaning from it. AI analytics platforms like Pulse AI bridge this gap automatically — they analyze your raw data, identify patterns, detect anomalies, and surface insights with recommended actions.
What Are the Steps to Analyze Business Data?
The data-to-insight process follows five steps, whether you do it manually or with AI:
Step 1: Collect and centralize. Gather data from all sources into one place. This means connecting your CRM, accounting software, website analytics, marketing platforms, and any databases or spreadsheets. The number one reason businesses fail at analytics is fragmented data — each tool has a piece of the picture, but nobody sees the whole thing. AI platforms like Pulse AI handle this automatically through pre-built integrations.
Step 2: Clean and validate. Raw data is messy. Duplicate records, inconsistent formatting (“United States” vs “US” vs “USA”), missing values, and outdated entries all corrupt your analysis. Manual cleaning takes hours; AI platforms do it automatically during ingestion.
Step 3: Analyze and find patterns. Look for trends (what is going up or down over time?), correlations (when X happens, does Y also happen?), outliers (what numbers are abnormally high or low?), and segments (do different customer groups behave differently?). AI excels here because it can test thousands of combinations in seconds that would take a human analyst weeks.
Step 4: Interpret and contextualize. A pattern is not an insight until you understand why it matters. “Sales drop 23% every January” is a pattern. “Sales drop 23% every January because enterprise procurement budgets reset in Q1 — we should launch a Q1 promotion targeting budget-flush buyers” is an actionable insight.
Step 5: Act and measure. Implement the decision, then track whether the outcome improved. This closes the loop and validates (or invalidates) your insight. Set up automated tracking so you know immediately whether your action worked.
How to Analyze Data Without Being a Data Scientist
You do not need statistical knowledge or coding skills to analyze business data in 2026. Here is what non-technical business owners can do:
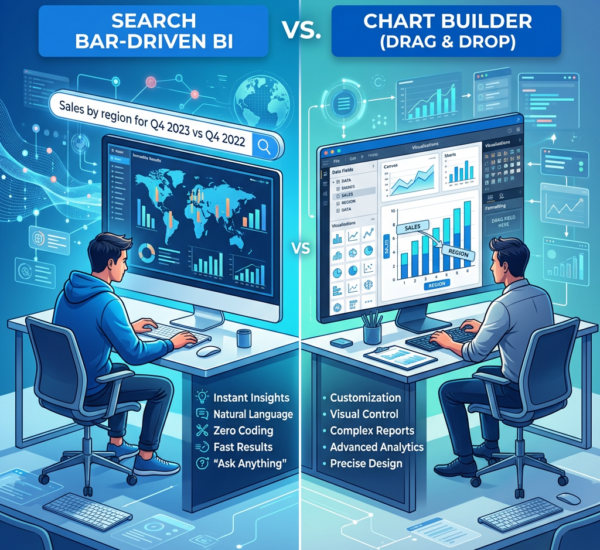
Use natural language querying. AI analytics platforms let you ask questions in plain English: “What were my top 5 products by profit margin last quarter?” or “Which marketing channel has the lowest customer acquisition cost?” The system translates your question into a data query, runs the analysis, and returns the answer with visualizations. Pulse AI is specifically designed for this — you type a question and get an insight.
Let AI surface insights proactively. Instead of knowing what questions to ask, modern platforms monitor your data continuously and alert you when something important happens: “Revenue from email marketing increased 45% this week — here is what changed” or “Customer churn rate just hit a 6-month high — these 3 segments are driving it.” You do not need to analyze anything manually; the AI does it for you.
Start with pre-built dashboards. Every industry has standard metrics. E-commerce tracks conversion rate, average order value, and customer lifetime value. SaaS tracks MRR, churn, and LTV:CAC ratio. Agencies track billable utilization and project profitability. Use pre-built templates as your starting point — you can customize later as you learn what matters most.
Focus on decisions, not analysis. The goal is never “do more analysis.” The goal is always “make a better decision.” Start with the decision you need to make (“Should I increase ad spend on TikTok?”), then find the data that answers it (“What is the CAC and ROAS from TikTok vs other channels?”). This decision-first approach keeps you focused.
What Are Examples of Actionable Business Insights?
Here are real examples of how raw data becomes actionable insights across different business functions:
Sales insight: Data shows that deals with a demo in the first 48 hours close at 3x the rate of deals where demo is delayed. Action: Implement a 48-hour demo guarantee for all qualified leads. Expected impact: 15-20% increase in close rate.
Marketing insight: Attribution analysis reveals that customers who read 3+ blog posts before signing up have 2x higher lifetime value than direct-conversion customers. Action: Increase content marketing budget by 30% and create a nurture sequence that drives prospects to educational content before the sales pitch.
Product insight: Usage data shows that 40% of customers never use Feature X, but 95% of churned customers never used Feature X. Action: Create an onboarding flow that guides users to Feature X in their first session. Expected impact: 10-15% reduction in churn.
Operations insight: Support ticket analysis reveals that 60% of tickets come from 3 specific product issues. Action: Fix those 3 issues to reduce support volume by 60%, saving $4,000/month in support costs.
Financial insight: Cash flow analysis shows that accounts receivable aging has increased from 30 days to 52 days over the past quarter. Action: Implement automated payment reminders at 15, 30, and 45 days. Expected impact: reduce aging back to 35 days, freeing up $120,000 in working capital.
How Do AI Analytics Tools Turn Data Into Insights Automatically?
Modern AI analytics platforms use several techniques to extract insights without human intervention:
Anomaly detection: The AI learns normal patterns in your data (daily sales range, typical traffic levels, expected churn rate) and alerts you instantly when something deviates. This catches problems and opportunities that manual review would miss.
Trend analysis: AI identifies trends across time periods, segments, and dimensions — finding correlations that humans would not think to check. Example: “Customers acquired through organic search have 40% higher retention than customers from paid ads, but only when they visit the pricing page before signing up.”
Predictive analytics: Based on historical patterns, AI forecasts future metrics: next month’s revenue, predicted churn, expected inventory needs, and cash flow projections. This shifts your decision-making from reactive (“what happened?”) to proactive (“what will happen?”).
Natural language insights: AI generates written summaries of what the data means: “Q4 revenue exceeded target by 12%, driven primarily by a 28% increase in enterprise deals. However, SMB segment revenue declined 8% due to increased churn from pricing tier changes implemented in October. Recommendation: consider a win-back campaign targeting churned SMB customers with a grandfather pricing offer.”
Pulse AI combines all of these capabilities in a single platform — connect your data, and the AI continuously monitors, analyzes, and delivers insights without you asking.
What Tools Do I Need to Go From Spreadsheets to Real Analytics?
If you are currently running your business analytics in spreadsheets, here is the migration path:
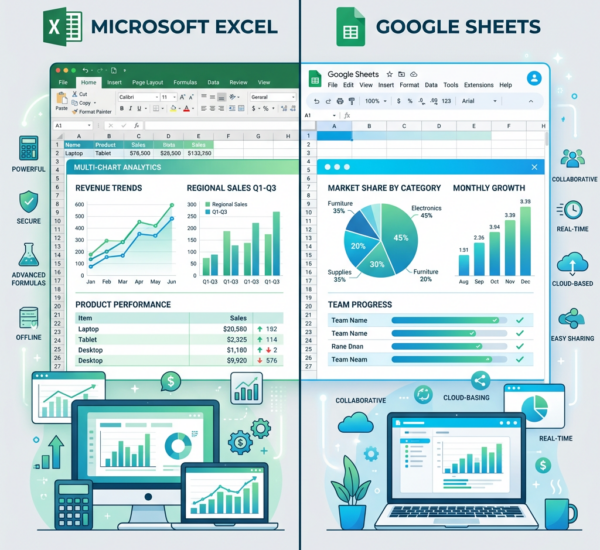
Level 1 — Enhanced spreadsheets (free): Move from Excel to Google Sheets with importrange formulas pulling data from other sheets, pivot tables for analysis, and basic charting. Add Google Analytics for web data. This works until you hit about $500K in annual revenue or 5+ data sources.
Level 2 — AI analytics platform ($50-200/month): Connect your business tools to a platform like Pulse AI. Get automated dashboards, natural language querying, anomaly alerts, and scheduled reports. No more manual data entry, no formula maintenance, no broken spreadsheets. This is the sweet spot for most small to mid-size businesses.
Level 3 — Full BI stack ($500-5,000/month): For larger companies with dedicated data teams: a data warehouse (BigQuery, Snowflake), ETL tools (Fivetran, Airbyte), and a BI layer (Tableau, Looker, or Power BI). This is enterprise-grade and requires data engineering expertise.
Most businesses should go directly from Level 1 to Level 2. Level 3 is overkill until you have 100+ employees or very complex data needs.
Frequently Asked Questions
How much data do I need before analytics is useful?
Even a few weeks of data is enough to start identifying patterns. You do not need years of historical data. AI platforms can find meaningful insights from small datasets — the key is having the right data (revenue, customers, traffic) connected, not having lots of it.
What is the biggest mistake companies make with data analytics?
Collecting data without acting on it. Many businesses invest in analytics tools, build beautiful dashboards, and then never change their behavior based on what the data shows. Analytics is only valuable when it leads to decisions and actions.
Can AI analytics replace human judgment?
AI replaces the mechanical work of data processing, pattern detection, and report generation. It does not replace human judgment about what to prioritize, how to interpret ambiguous results, or what strategic direction to take. Think of AI analytics as giving you perfect information — you still make the decisions.
How long until I see ROI from analytics?
Most businesses see actionable insights within the first week of connecting their data. The first cost-saving or revenue-generating insight typically pays for the annual platform cost. Ongoing ROI compounds as you build on each insight with better decisions over time.