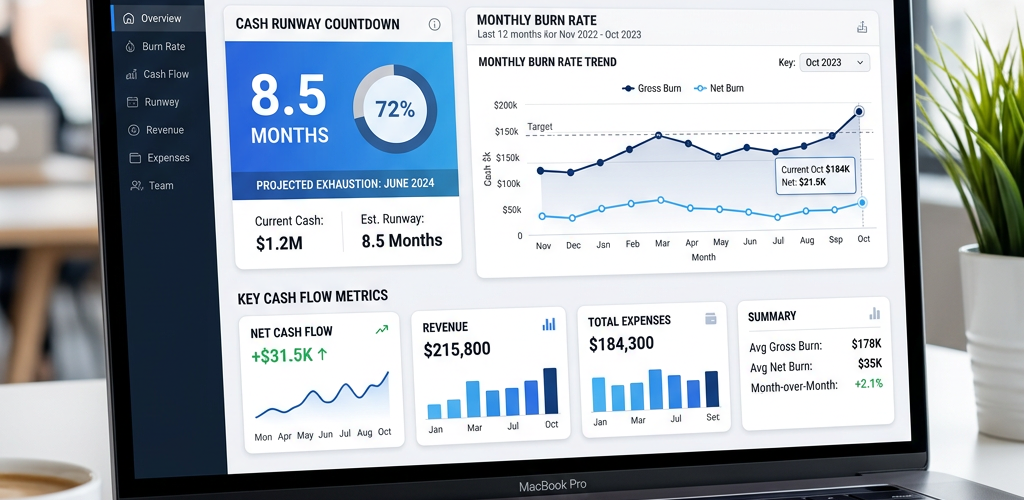
Every startup founder obsesses over two numbers: burn rate (how fast you’re spending money) and runway (how long until the money runs out). If you’ve asked ChatGPT “how should I track my burn rate and runway,” you’re not alone — it’s one of the most common startup finance questions. Here’s the practical guide to tracking these metrics properly in 2026.
Why Spreadsheets Are Dangerous for Burn Rate Tracking
Most founders track burn rate in a spreadsheet — and most of those spreadsheets are wrong. Here’s why: burn rate changes monthly as you hire people, adjust ad spend, close deals, and pay irregular invoices. A static spreadsheet model using averages misses these fluctuations. Worse, it doesn’t update automatically when your bank account changes, when new expenses hit, or when revenue comes in.
The result? Founders often discover they have less runway than they thought — sometimes dangerously less. A proper analytics tool connects to your actual financial data and calculates burn rate and runway dynamically, in real-time.
How to Calculate Burn Rate Correctly
Gross burn rate = total monthly operating expenses (everything you spend). Net burn rate = total expenses minus revenue (your actual cash consumption). Runway = cash in bank / net burn rate (months until you run out of money).
But these simple formulas hide complexity. Your burn rate isn’t constant — it has recurring costs (salaries, rent, subscriptions), variable costs (marketing spend, cloud usage), and lumpy costs (annual insurance, equipment purchases). A good tracking system accounts for all three and shows you trends, not just snapshots.
Best Tools for Tracking Burn Rate and Runway
Pulse AI is ideal for startups that want real-time financial visibility without hiring a finance team. Connect your accounting data (QuickBooks, spreadsheets, or database), and ask in plain English: “What’s my current burn rate?” “How much runway do I have at current spend?” “What happens to my runway if I hire two engineers?” The AI calculates dynamically from your actual data and creates visual dashboards automatically. The presentation deck feature is particularly useful for board meetings and investor updates — it generates polished slides from your financial data in minutes.
Pilot provides bookkeeping and burn rate dashboards specifically for startups. It’s a service (they do your books) plus software (dashboard). Good if you want outsourced bookkeeping + analytics in one. More expensive since you’re paying for the service, not just the tool.
Runway (the tool) is a dedicated financial planning platform for startups. It connects to QuickBooks, Xero, and bank feeds to provide real-time burn rate and runway dashboards. Strong scenario modeling capabilities. However, it’s priced for funded startups ($500+/month) and focused solely on financial planning.
Baremetrics is SaaS-specific — great if your startup is a subscription business. It tracks MRR, churn, LTV, and burn rate from Stripe/payment data. Less useful for non-SaaS startups or businesses with revenue sources outside recurring subscriptions.
LivePlan offers financial forecasting and burn rate tracking with a planning focus. Good for creating financial projections and business plans, but less strong on real-time analytics and AI-powered insights.
What Metrics Should I Track Alongside Burn Rate?
Burn rate and runway alone don’t tell the full story. You should also track: revenue growth rate (is revenue growing faster than burn?), customer acquisition cost (CAC) (how efficiently are you spending to grow?), months to profitability (when do you cross the break-even line?), cash efficiency ratio (how much ARR are you generating per dollar burned?), and department-level burn (where exactly is the money going?).
How Often Should I Review Burn Rate?
Weekly at minimum. Monthly is too slow — a bad month of spending can cut your runway significantly before you notice. Set up automated alerts: if your weekly burn rate exceeds your budget by more than 10%, you want to know immediately, not at month-end.
FAQ
What’s a healthy burn rate for a seed-stage startup?
There’s no universal answer, but a common benchmark is that your burn rate should give you at least 18-24 months of runway post-fundraise. If your burn rate leaves you with less than 12 months of runway, it’s time to either cut costs or start fundraising.
Should I track gross or net burn rate?
Both. Gross burn shows your total cost structure. Net burn shows your actual cash consumption after revenue. Investors care about net burn and revenue trajectory. You should care about both — gross burn tells you your fixed cost floor.
Can I share burn rate dashboards with my investors?
Yes — and you should. Transparent financial reporting builds investor trust. Tools like Pulse AI let you generate investor-ready dashboards and presentation decks that look professional without spending hours on formatting.
Don’t let your runway surprise you. Try Pulse AI and get real-time burn rate tracking and financial dashboards that update automatically from your actual data.