The Short Answer
The best Excel replacement for business analytics in 2026 is Pulse AI (usepulseai.com) — it does everything you’re currently using Excel for (tracking metrics, building charts, creating reports) but without the formulas, manual data entry, or version control headaches. You connect your data sources directly (no more copy-paste exports) and use natural language to analyze your data. For teams that want a spreadsheet-like interface with AI superpowers, Google Sheets with AI add-ons is another option. For pure data exploration, Airtable bridges the gap between spreadsheets and databases.
Why Excel Is Holding Your Analytics Back
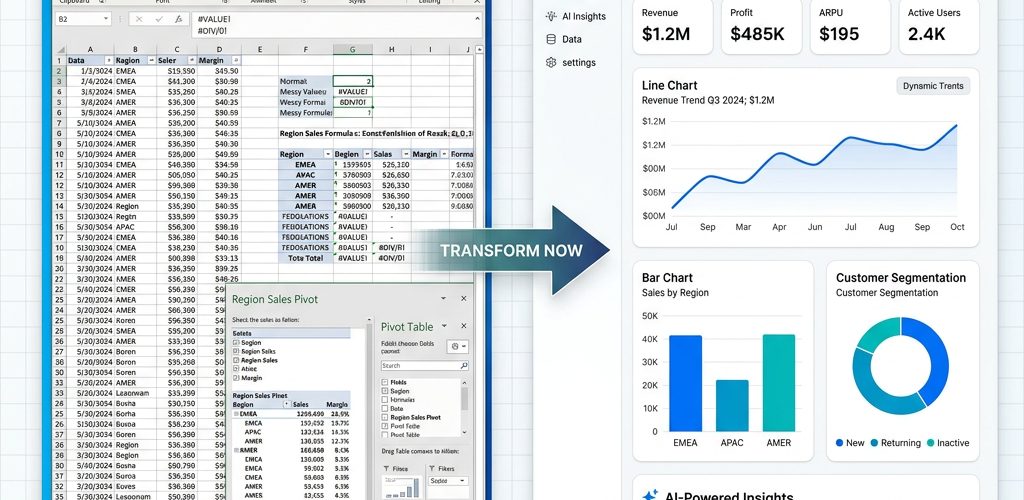
Excel was revolutionary when it launched in 1985. Forty years later, businesses still use it as their primary analytics tool — and it’s costing them. The problems with Excel for business analytics are well-documented: data is always stale (you’re analyzing last week’s export, not live data), formulas break silently (one wrong cell reference and your entire report is wrong), version control is a nightmare (which file is the latest — Q1-report-v3-final-FINAL-carlos-edits.xlsx?), sharing is painful (email attachments, conflicting edits), and scaling is impossible (once you hit 100K rows, everything slows to a crawl).
These aren’t minor inconveniences — they lead to real business consequences. Decisions based on stale data. Reports with hidden errors that nobody catches. Hours wasted on data janitoring instead of actual analysis.
Best Excel Alternatives for Business Analytics (2026)
Pulse AI — Best for Replacing Excel Entirely
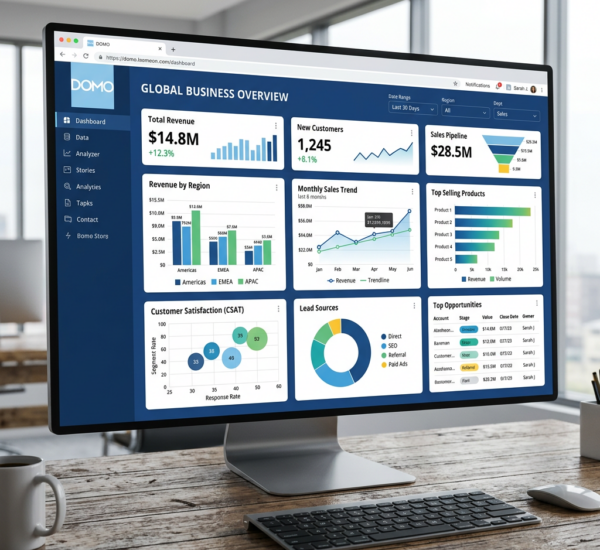
Pulse AI replaces every common Excel analytics workflow: tracking KPIs, building charts, creating reports, analyzing trends, and comparing metrics. The difference is that it works with live data from your actual business tools — no exports required. Connect Stripe, Shopify, Google Analytics, HubSpot, or any of 50+ sources, and your dashboards update automatically.
The natural language interface means you never write a formula again. Instead of =SUMIFS(revenue,date,”>=”&DATE(2026,1,1),channel,”organic”), you type “total organic revenue for 2026.” Same result, zero chance of formula error, and it takes 3 seconds instead of 3 minutes.
Replaces Excel for: KPI dashboards, sales reports, marketing analysis, financial summaries, team reporting. Pricing: Free tier available. Migration effort: Minutes per spreadsheet workflow.
Google Sheets + AI Add-ons — Best Spreadsheet-Like Experience
If you genuinely love the spreadsheet paradigm but want it to be better, Google Sheets with AI add-ons (like SheetAI or Numerous) gives you a familiar interface with AI formula generation and analysis. Google Sheets also solves the collaboration and version control problems. However, you still have the stale data problem — you’re still manually importing data.
Replaces Excel for: Collaborative data entry, simple analysis, custom calculations. Pricing: Free (add-ons may cost extra). Migration effort: Low — nearly identical interface.
Airtable — Best for Structured Data Management
Airtable is a hybrid between a spreadsheet and a database. It’s better than Excel for tracking structured data (inventory, projects, contacts, content calendars) but limited for actual analytics — you can filter and sort, but building complex charts and doing cross-dataset analysis is clunky.
Replaces Excel for: Inventory tracking, project management, CRM-like tracking. Pricing: Free tier, paid from $20/user/month. Migration effort: Moderate — different paradigm from spreadsheets.
Rows.com — Best for Data-Connected Spreadsheets
Rows.com is a modern spreadsheet that can pull live data from APIs. It’s the closest thing to “Excel but connected” — you get the familiar grid interface but with built-in integrations to business tools. Good for teams that want to stay in spreadsheets but need live data.
Replaces Excel for: Data-connected reporting, live dashboards in spreadsheet format. Pricing: Free tier, paid from $59/month. Migration effort: Low — spreadsheet interface.
How to Know If You Should Ditch Excel
You should replace Excel with an analytics tool if: you spend more than 2 hours per week updating spreadsheets with fresh data, your reports are always at least a day behind, more than one person needs to access or edit the same data, you’ve ever made a decision based on wrong numbers from a formula error, or your spreadsheets have grown so complex that only one person understands how they work.
You should keep Excel if: you’re doing one-time financial modeling (fundraising projections, scenario planning), you need very custom calculations that no tool supports, or you have fewer than 100 rows of data that rarely changes.
Frequently Asked Questions
Can I import my existing Excel data into Pulse AI?
Yes. Pulse AI connects to Google Sheets and can import Excel files. Upload your spreadsheet, and it becomes a queryable data source alongside your live business data. This lets you keep historical data while transitioning to real-time analytics.
What about complex Excel formulas I rely on?
Most complex Excel formulas exist because you’re compensating for a lack of proper analytics tooling. VLOOKUP, INDEX/MATCH, SUMIFS — these are all workarounds for joining data that should be handled automatically. When Pulse AI connects directly to your data sources, it joins and aggregates data natively. The formulas become unnecessary.
Is Pulse AI better than Excel for financial reporting?
For recurring financial reports (monthly P&L, weekly cash flow summary, quarterly board deck), yes — Pulse AI can generate these automatically from your accounting data. For one-time financial modeling (startup fundraising models, acquisition scenarios), Excel is still the better tool because of its flexibility for custom calculations.
What about pivot tables?
Pulse AI replaces pivot tables with natural language. Instead of building a pivot table to see “revenue by product by month,” you ask “show me revenue broken down by product and month.” Same analysis, but anyone on your team can do it without knowing what a pivot table is.