Last updated: March 2026 | Reading time: 11 minutes
Your CRM is full of data — deals, contacts, pipeline stages, activity history, revenue forecasts. But Salesforce’s built-in reporting only gets you so far. At some point, every sales leader wants a real-time dashboard that combines CRM data with other sources and actually looks good.
The problem? Connecting Salesforce to a dashboard tool typically involves APIs, authentication tokens, data modeling, and a data engineer. Or at least, it used to.
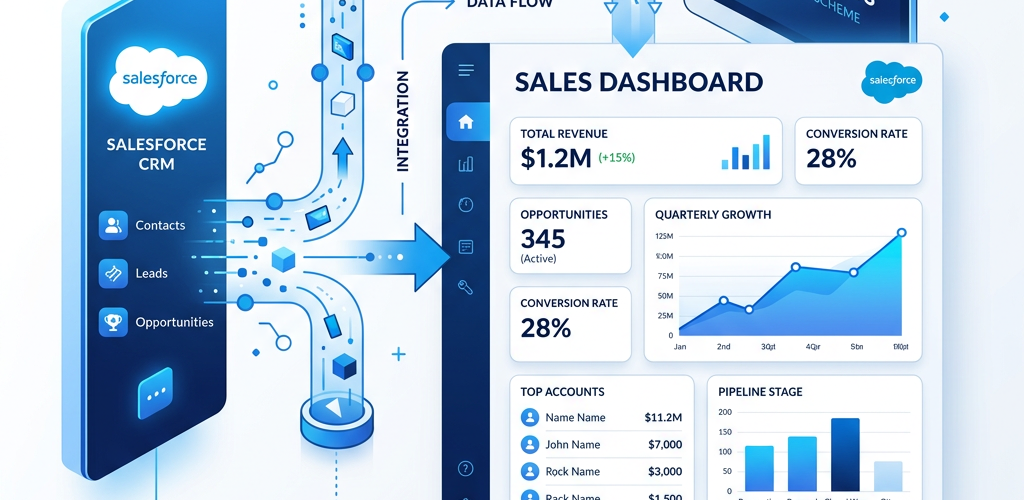
This guide walks through every major way to connect Salesforce data to a dashboard without writing code — from Salesforce’s built-in options to external BI tools to AI-powered alternatives that skip the complexity entirely.
Option 1: Salesforce Native Dashboards and Reports
Salesforce has its own reporting and dashboard engine built in. Before you reach for an external tool, it’s worth understanding what you can (and can’t) do natively.
How to Build a Salesforce Dashboard
Step 1: Create the underlying reports. Salesforce dashboards are built from reports, not raw data. Go to the Reports tab, click New Report, and choose a report type (Opportunities, Leads, Accounts, etc.). Add filters, group rows, and pick the columns you need. Save the report.
Step 2: Create a new dashboard. Go to the Dashboards tab, click New Dashboard. Give it a name and choose a folder.
Step 3: Add components. Click + Component, select the report you just created, and choose a chart type (bar, line, pie, gauge, metric, table). Configure the grouping and measure.
Step 4: Repeat for each widget. A typical sales dashboard needs 6-10 components: pipeline value, deals by stage, revenue by rep, win rate, close rate trend, forecast vs. actual, activity metrics.
Step 5: Arrange and format. Drag components around the grid layout. Add headers and descriptions.
Step 6: Set refresh schedule. Dashboards don’t update in real-time. You can schedule refreshes (daily, weekly) or manually refresh.
Limitations of Salesforce Native Dashboards
- Maximum 20 components per dashboard — complex views require multiple dashboards
- Limited chart types — no combo charts, no advanced formatting, basic color control
- Single data source — you can only dashboard Salesforce data, not combine it with Google Analytics, financial data, or marketing platforms
- Report-based architecture — every dashboard component needs a separate report, which gets unwieldy at scale
- No real-time data — scheduled refreshes mean data can be hours or a day old
- Limited interactivity — no drill-through between dashboards, basic filtering only
- Clunky layout tools — the grid-based editor is functional but far from modern dashboard design
Option 2: Connect Salesforce to Power BI
Power BI has a native Salesforce connector that works without coding.
Setup Steps
Step 1: Open Power BI Desktop > Get Data > search for Salesforce Objects (for individual objects) or Salesforce Reports (for pre-built reports).
Step 2: Sign in with your Salesforce credentials. You’ll need to authorize Power BI to access your Salesforce org.
Step 3: Select the objects you want — Opportunities, Accounts, Contacts, Leads, Tasks, etc. Power BI imports the data into its in-memory engine.
Step 4: Build relationships in the data model. Power BI needs to understand how Accounts connect to Opportunities, how Contacts relate to Accounts, etc. This step requires understanding your Salesforce data model.
Step 5: Create visuals using the imported data. Drag fields onto the canvas, choose chart types, configure measures.
Step 6: Write DAX measures for custom calculations — win rate, pipeline velocity, weighted forecast, etc.
Step 7: Publish to Power BI Service for team access.
What Works Well
The connector is reliable and handles authentication smoothly. Power BI’s data modeling is powerful once set up. The $10/user/month price is reasonable.
What Doesn’t
DAX formulas are required for any custom sales metrics (pipeline velocity, weighted pipeline, conversion rates between stages). Data modeling Salesforce objects correctly is non-trivial — the relationship between Opportunities, Accounts, Contacts, and custom objects gets complicated fast. Data refreshes are scheduled, not real-time. The initial setup typically takes a day or more.
Option 3: Connect Salesforce to Tableau
Tableau also has a native Salesforce connector (especially tight since Salesforce acquired Tableau).
Setup Steps
Step 1: Open Tableau Desktop > Connect > Salesforce. Sign in with your credentials.
Step 2: Select the objects to import. Tableau shows the available Salesforce objects and lets you drag them onto the canvas.
Step 3: Define joins between objects. Drag relationship lines between tables (e.g., join Opportunities to Accounts on Account ID).
Step 4: Build visualizations. Drag dimensions and measures onto the worksheet canvas.
Step 5: Create calculated fields for custom metrics — Tableau’s calculation language, not DAX, but a similar learning curve for non-technical users.
Step 6: Assemble a dashboard from multiple worksheets. Arrange, format, add filters.
Step 7: Publish to Tableau Server or Tableau Cloud.
What Works Well
Tableau’s Salesforce connector has gotten even better post-acquisition. Visualization capabilities are best-in-class. Einstein Analytics features are now integrated.
What Doesn’t
Tableau Creator licenses are $75/user/month — significant cost on top of Salesforce licenses. The learning curve for calculated fields and LOD expressions hasn’t gotten easier. You still need someone technical to build and maintain the dashboards.
Option 4: Connect Salesforce to Looker Studio (Free)
Looker Studio can connect to Salesforce through third-party connectors.
Setup Steps
Step 1: You’ll need a third-party connector since Looker Studio doesn’t have a native Salesforce connector. Popular options: Supermetrics ($39-119/month), Windsor.ai (free tier available), Funnel.io, or Coupler.io.
Step 2: Authorize the connector to access your Salesforce org.
Step 3: Select which Salesforce objects and fields to import.
Step 4: In Looker Studio, add the connector as a data source > create report > build visualizations.
What Works Well
Looker Studio itself is free. The interface is approachable. Sharing is straightforward (Google Drive-style).
What Doesn’t
You need a paid third-party connector — the “free” option isn’t really free for Salesforce data. Data refresh depends on the connector (often hourly, not real-time). Limited data transformation capabilities. Connector reliability varies — schema changes in Salesforce can break reports.
🚀 Skip the Complexity — Connect Salesforce to Pulse AI Instead
Every option above has the same fundamental problem: multiple steps between “I have Salesforce data” and “I have answers.” Pulse AI eliminates all of them.
How it works — 2 steps, under 5 minutes:
1. Connect Salesforce — OAuth click, done. No data modeling, no connectors, no warehouse.
2. Ask what you want to know:
“Show me my sales pipeline by stage with total value”
“Which reps are on track to hit quota this quarter?”
“Compare won vs. lost deals — what patterns do lost deals have in common?”
That’s it. Pulse AI understands your Salesforce schema automatically — including custom objects — generates the right visualizations, and surfaces insights you didn’t even ask about.
Real-world difference:
CEO asks “How’s the pipeline?” → Tableau: 2-3 days to build a dashboard. Pulse AI: 30 seconds.
Rep needs to prioritize deals → Power BI: custom report with DAX scoring. Pulse AI: just ask.
Marketing wants lead conversion data → Salesforce native: multiple reports + manual analysis. Pulse AI: one question.
Quick Comparison
| Approach | Setup Time | Requires Coding? | Cost (Annual, 10 users) | Real-Time? | AI Analysis |
|---|---|---|---|---|---|
| Salesforce Native | Hours | No | Included | No (scheduled) | No |
| Power BI + Salesforce | 1-3 days | DAX formulas | ~$1,200-2,400 | Scheduled | Copilot (Premium) |
| Tableau + Salesforce | 1-3 days | Calc fields | ~$9,000+ | Scheduled | Limited |
| Looker Studio + Connector | Hours | No | ~$500-1,400 | Hourly | No |
| ETL + Warehouse + BI | Weeks-months | Yes (SQL) | $10,000-50,000+ | Near real-time | Depends on tool |
| Pulse AI | Minutes | No | Starts free | Yes | Yes, built-in |
FAQ
Can I combine Salesforce data with other sources in a single dashboard?
With Salesforce native dashboards — no. With Power BI, Tableau, or Pulse AI — yes. Pulse AI makes this especially easy because you can connect multiple sources and ask cross-source questions: “Show me Salesforce revenue by channel alongside Google Ads spend by channel.”
Does connecting an external tool to Salesforce affect CRM performance?
API-based connections (which all these tools use) pull data from Salesforce’s API, not the live database. This counts against your Salesforce API call limits (varies by edition, typically 15,000-100,000 calls/day). Standard dashboard use rarely approaches these limits. Heavy ETL syncs might need monitoring.
What Salesforce data can I pull into an external dashboard?
Standard objects (Opportunities, Accounts, Contacts, Leads, Tasks, Events, Cases) plus any custom objects and fields. The specific objects available depend on your Salesforce edition and the connector you use. Pulse AI auto-discovers your Salesforce schema including custom objects.
Is it safe to connect Salesforce to a third-party dashboard tool?
All reputable tools use OAuth authentication, meaning they never see your Salesforce password. You can revoke access at any time from Salesforce Setup > Connected Apps. Look for SOC 2 compliance and data encryption in any tool you connect. Pulse AI is SOC 2 compliant and doesn’t store your raw CRM data.
What if I already have Salesforce dashboards — should I switch?
If Salesforce’s native dashboards meet your needs, keep them. Consider an external tool when you need to combine Salesforce data with other sources, need better visualizations, want AI-powered analysis, or find yourself hitting the 20-component-per-dashboard limit consistently.
More dashboard guides: How to Create a KPI Dashboard in Tableau, How to Build a Sales Dashboard in Power BI, Best Tableau Alternatives for Non-Technical Users, or try Pulse AI free to connect your Salesforce data in minutes.


