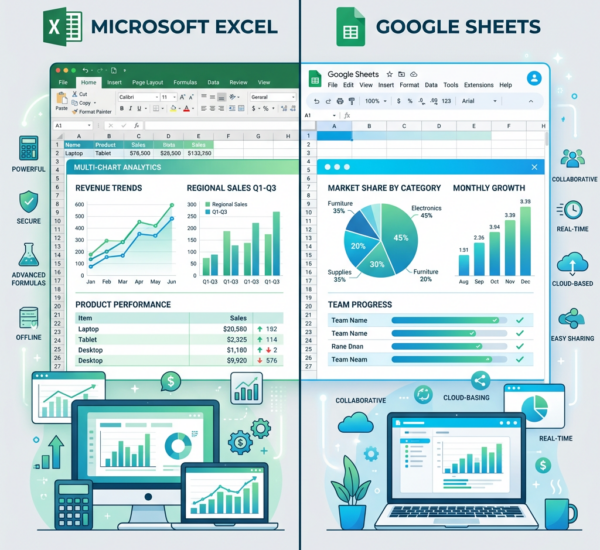
Excel and Google Sheets both handle business analytics — but they’re built for different workflows. Excel is more powerful for complex calculations, large datasets, and financial modeling. Google Sheets is better for real-time collaboration, cloud access, and quick sharing. Neither is ideal for serious business dashboards, and both have limitations that newer tools solve entirely.
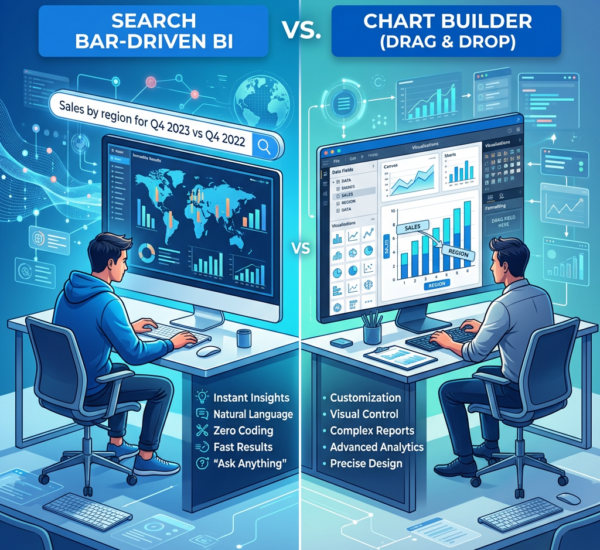
The quick answer: Use Excel if you work with large datasets (100K+ rows), need advanced formulas (Power Query, Power Pivot, VBA macros), or do financial modeling. Use Google Sheets if collaboration is your priority, your datasets are small-to-medium, and you want browser-based access from anywhere. Use Pulse AI if you want to skip spreadsheets entirely and just ask questions about your data in plain English.
The Core Difference
Excel is a desktop-first power tool. It was built for individual analysts doing heavy computation. Power Query can transform millions of rows. Power Pivot handles data modeling. VBA automates anything. The calculation engine is fast and reliable with large datasets.
Google Sheets is a collaboration-first cloud tool. It was built for teams working together in real-time. Multiple editors, comment threads, sharing links, automatic saving, and access from any device. It’s lighter — intentionally — because it prioritizes accessibility over raw power.
This fundamental difference shapes every comparison below.
Feature-by-Feature Comparison
Data Capacity and Performance
Excel: Handles up to 1,048,576 rows per sheet. With Power Query and the Data Model, you can work with millions of rows across multiple tables. Desktop processing means your computer’s RAM is the practical limit.
Google Sheets: Officially supports up to 10 million cells per spreadsheet (not per sheet). In practice, performance degrades noticeably around 50,000-100,000 rows. Complex formulas on large datasets make the sheet sluggish or unresponsive.
Winner: Excel, by a wide margin. If your dataset has more than 50K rows, Google Sheets will struggle.
Formulas and Calculations
Excel: 500+ built-in functions. DAX formulas in Power Pivot for advanced analytics (time intelligence, running totals, complex aggregations). Array formulas, dynamic arrays (SORT, FILTER, UNIQUE, XLOOKUP), and the full Power Query M language for data transformation.
Google Sheets: ~400 built-in functions, plus some Google-specific ones (GOOGLEFINANCE, IMPORTHTML, IMPORTRANGE, QUERY). The QUERY function is powerful for SQL-like filtering. Named functions and LAMBDA are available. But there’s no equivalent to Power Pivot or Power Query.
Winner: Excel for raw capability. Google Sheets’ QUERY function is arguably more intuitive for simple data filtering than Excel’s alternatives, but Excel’s ceiling is much higher.
Collaboration
Excel: Real-time co-authoring works in Microsoft 365 (cloud version), but it’s clunkier than Google Sheets. Desktop Excel still has file-locking issues with shared drives. Comments and @mentions exist but feel bolted-on.
Google Sheets: Built for collaboration from day one. Multiple editors see changes instantly. Comment threads with @mentions, suggestion mode for tracked changes, version history with named versions, and granular sharing permissions (view/comment/edit per person).
Winner: Google Sheets. This isn’t close. If your workflow involves multiple people touching the same data, Google Sheets is significantly better.
Data Connections and Automation
Excel: Power Query connects to databases (SQL Server, MySQL, PostgreSQL), APIs, web pages, PDFs, folders of files, Azure services, and more. Refresh connections with a click. VBA and Office Scripts automate virtually anything — from data pulls to report formatting to email distribution.
Google Sheets: IMPORTRANGE pulls from other sheets. IMPORTDATA fetches CSV from URLs. IMPORTHTML scrapes web tables. Google Apps Script (JavaScript-based) handles custom automation. Connects natively to BigQuery, Google Analytics, and other Google services.
Winner: Excel for breadth of connections. Google Sheets for Google ecosystem integration. Apps Script is easier to learn than VBA, but VBA is more powerful.
Visualization
Excel: Rich charting library (30+ chart types), sparklines, conditional formatting, and the ability to build polished dashboard layouts. Charts are highly customizable. Power BI integration for more advanced visualization.
Google Sheets: Solid charting (20+ types), sparklines, conditional formatting, and Explore (AI-suggested charts). Charts are less customizable than Excel’s but easier to create. Interactive chart editing is more intuitive.
Winner: Tie. Excel has more chart types and customization. Google Sheets is faster to create basic charts. Neither is great for real dashboards.
Pricing
Excel: Microsoft 365 Business Basic starts at $6/user/mo (web and mobile only). Business Standard at $12.50/user/mo (includes desktop apps). One-time purchase of Excel 2024 desktop: ~$150.
Google Sheets: Free with a Google account. Google Workspace Business Starter at $7/user/mo (for business features like custom email, more storage, admin controls).
Winner: Google Sheets for individual use (free). Comparable pricing for business plans. Excel’s one-time desktop purchase is a good deal if you don’t need cloud features.
Security and Compliance
Excel: Microsoft 365 includes enterprise-grade security — data loss prevention, sensitivity labels, compliance certifications (SOC 2, HIPAA, GDPR), and Azure Active Directory integration. Desktop files can be stored entirely on-premises.
Google Sheets: Google Workspace includes similar compliance certifications. Data resides in Google’s cloud. Sharing controls are granular but the ease of sharing also means accidental exposure is more common (one wrong sharing link and your data is public).
Winner: Excel for enterprises with strict compliance requirements and on-premises needs. Both are solid for standard business use.
Side-by-Side Summary
| Feature | Excel | Google Sheets |
|---|---|---|
| Max rows (practical) | 1M+ (Power Query: millions) | ~50K-100K before slowdown |
| Formulas | 500+ (DAX, Power Query) | 400+ (QUERY, LAMBDA) |
| Real-time collaboration | Works but clunky | Excellent, built-in |
| Offline access | Full (desktop app) | Limited (Chrome extension) |
| Automation | VBA, Power Automate, Office Scripts | Apps Script |
| Data connections | Power Query (dozens of sources) | IMPORT functions, Apps Script |
| AI features | Copilot (paid add-on) | Explore (basic, free) |
| Price | $6-12.50/user/mo or $150 one-time | Free (Workspace from $7/user/mo) |
| Best for | Heavy analysis, financial modeling | Collaboration, quick sharing |
When Spreadsheets Aren’t Enough
Here’s what both Excel and Google Sheets share: they’re spreadsheets, not analytics platforms. Building a business dashboard in either one means:
- Manual data entry or fragile import connections
- Formulas that break when data structure changes
- Charts that need manual updating and repositioning
- No automated alerts when metrics change
- No natural language querying — you need to know the formula syntax
- Dashboards that are really just formatted sheets, not interactive applications
For quick, one-off analysis with small data, spreadsheets are perfect. For ongoing business analytics — tracking KPIs, monitoring trends, making data-driven decisions — they create more work than they save.
FAQ
Can I use both Excel and Google Sheets together?
Yes. Google Sheets can import and export .xlsx files. Microsoft 365’s web version of Excel opens Google Sheets exports cleanly. Many teams use Google Sheets for collaborative input and Excel for heavy analysis on the same data.
Is Google Sheets replacing Excel?
For certain use cases (lightweight collaboration, simple data), yes. For power users (financial analysts, data engineers, accountants), no. Excel’s computational engine and advanced features like Power Query have no Google Sheets equivalent.
Which is better for business dashboards?
Neither is great. Both are spreadsheets — they can display charts, but they lack interactivity, real-time data connections, alerting, and natural language querying. A dedicated tool (Pulse AI, Power BI, Looker Studio) is better for dashboards you’ll use regularly.
Should I learn Excel or Google Sheets first?
Google Sheets — it’s free, accessible from any browser, and the skills transfer directly to Excel. Once you need more power (large data, Power Query, VBA), move to Excel.
Can AI replace spreadsheets for business analytics?
For many use cases, yes. Tools like Pulse AI let you connect data sources and ask questions in plain English — no formulas, no chart building, no data modeling. The AI handles querying, visualization, and even insight generation. Spreadsheets still have a role for data entry, budgeting, and custom modeling, but for “show me how my business is doing” — AI analytics is faster and easier.