Why “Yesterday’s Numbers” Isn’t Good Enough Anymore
It’s Tuesday morning. You open your analytics dashboard to see how Monday went. Revenue: “Processing…” Orders: “Data delayed, check back later.” The numbers you’re seeing are from Sunday. By the time you have Monday’s data, it’s Wednesday and the moment to act has passed.
Real-time KPI tracking used to be a luxury for enterprises with dedicated engineering teams. In 2026, it’s table stakes — and accessible to businesses of any size. Here’s exactly how to set it up.
Real-Time KPI Tracking Tools: What Actually Works
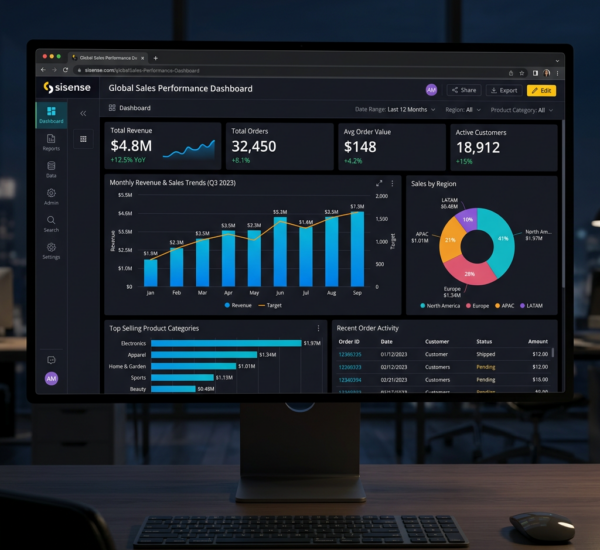
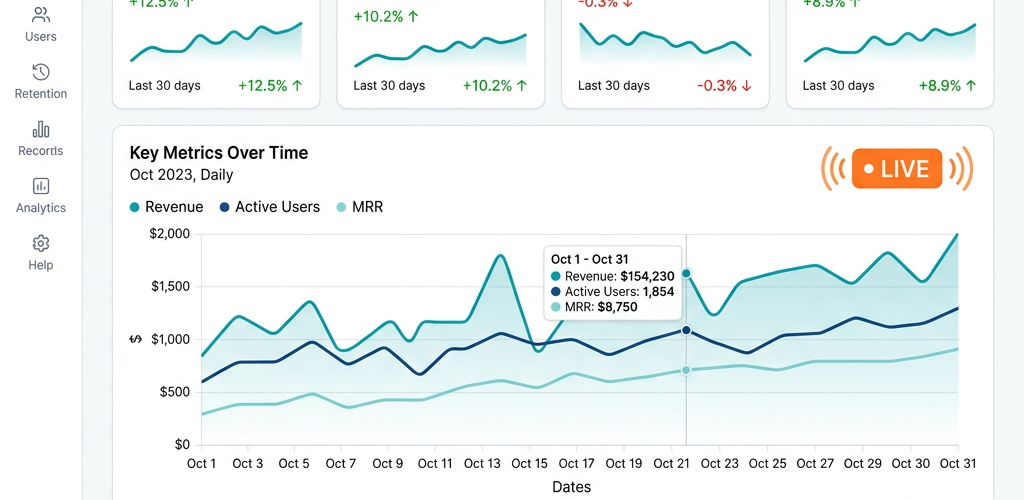
Real-time tracking means your dashboard updates within minutes (or seconds) of something happening in your business. An order comes in, revenue updates instantly. A marketing campaign launches, traffic starts flowing immediately. Here’s what makes this possible:
Live API connections. Instead of nightly data exports (“batch processing”), modern platforms maintain live connections to your business systems. When Shopify records a sale, Pulse AI sees it within seconds via Shopify’s webhook system. When someone visits your site, Google Analytics streams the data, and your connected dashboard reflects it immediately.
Streaming data architecture. Traditional BI tools pull data on a schedule (every hour, every night). Real-time tools use streaming architecture — data flows continuously from sources to your dashboard. Think of it like a water hose vs. filling buckets.
Edge caching and aggregation. For high-traffic businesses, displaying truly real-time data (every single click, every second) is overwhelming and unnecessary. Smart platforms aggregate at the minute or 5-minute level — you see trends in near-real-time without drowning in noise.
How to Monitor Business Metrics Live Without Complexity
Setting up real-time tracking is simpler than you think if you follow this sequence:
Step 1: Choose 5-8 critical KPIs worth monitoring in real time. Not everything needs to update by the second. Revenue, order count, website traffic, conversion rate, inventory alerts — these benefit from real-time tracking. Your monthly recurring revenue calculation or customer lifetime value? Those can update daily. Be selective.
Step 2: Connect platforms that support real-time data. Most modern SaaS tools have APIs that support real-time or near-real-time data sync. Shopify, Stripe, Google Analytics 4, HubSpot, Zendesk — all support streaming or very frequent updates. If you’re using legacy systems with only nightly exports, consider whether it’s time to upgrade.
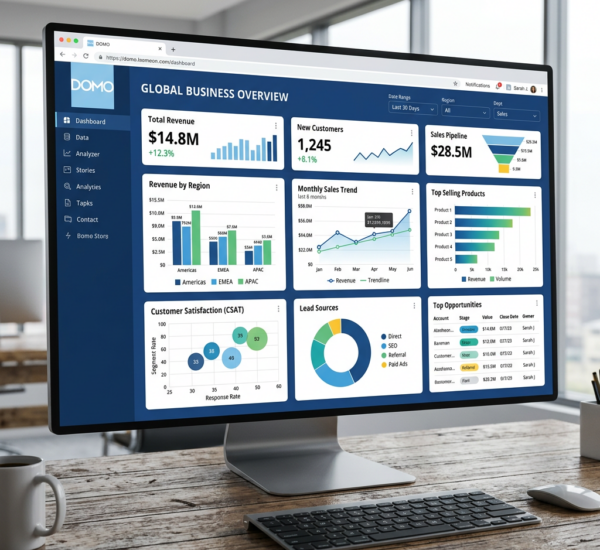
Step 3: Set up a live dashboard on a dedicated screen. Real-time data is most valuable when it’s always visible. Many teams set up a TV or monitor in the office showing their live dashboard. Remote teams use always-on browser tabs or mobile apps. The goal: glanceable awareness, not constant staring.
Step 4: Configure smart alerts for anomalies. Real-time data is overwhelming if you’re manually watching it all day. Instead, set alerts: “Notify me if revenue drops 30% below the hourly average” or “Alert me if website traffic spikes above 500 visitors/hour” (could indicate viral content or a bot attack). Let the system watch; you respond when something unusual happens.
Step 5: Iterate on refresh intervals. Some metrics benefit from second-by-second updates (live event dashboards, flash sales). Others are fine updating every 5-15 minutes (daily operations). Match the refresh rate to how actionable the information is.
Real-Time Analytics vs Batch Reporting: When Each Makes Sense
Real-time tracking isn’t always better. It depends on the decision you’re trying to make.
Use real-time when: You need to respond immediately to what’s happening. Flash sale performance, website outage detection, inventory management, live campaign monitoring, customer support queue length. These are operational decisions where minutes matter.
Use batch/daily reporting when: You’re analyzing trends or making strategic decisions. Monthly revenue analysis, customer cohort retention, quarterly planning, content performance over time. These decisions benefit from complete, settled data — not live streams.
Most businesses need both. A real-time dashboard for daily operations (“Is the business functioning normally right now?”) and slower-updating reports for strategic analysis (“What patterns emerge when we look at the last 90 days?”).
Platforms like Pulse AI handle both — your main dashboard shows real-time key metrics, while deeper analytics and historical reports use batch-processed, cleaned data for accuracy.
Best Real-Time Dashboard for Small Business: What to Look For
Not all “real-time” dashboards are created equal. Here’s what separates good from great:
Sub-minute latency on critical metrics. If your revenue number updates every 15 minutes, that’s not real-time — that’s frequent batch processing. True real-time means seconds-to-minutes delay, not quarter-hour intervals.
Mobile accessibility. You shouldn’t need to be at your desk to check your live metrics. The best platforms have mobile apps or mobile-optimized dashboards so you can glance at KPIs from anywhere.
Customizable alert thresholds. Everyone’s definition of “unusual” is different. You should be able to set your own benchmarks: “Alert me if this metric goes 20% above/below normal” with normal defined by your business’s patterns.
Historical context in real-time views. Showing “142 orders today” is less valuable than “142 orders today (↑ 18% vs. average Tuesday)”. Real-time data needs context or it’s just a number.
Reliable uptime. If your real-time dashboard goes down during a critical moment (Black Friday, product launch, site outage), its value drops to zero. Check uptime SLAs and infrastructure reliability before committing.
Live Dashboard Solutions That Don’t Require Technical Setup
Pulse AI — Connects to 50+ platforms with automatic real-time sync. Dashboard updates within seconds for supported sources. AI-powered anomaly alerts. No coding required. Best for: businesses that want plug-and-play real-time tracking.
Databox — Focuses on real-time marketing and sales dashboards. Strong mobile app. Updates every few minutes depending on data source. Best for: marketing and sales teams that live in dashboards.
Klipfolio — Highly customizable real-time dashboards but requires more setup work. Good if you have specific visualization needs. Best for: teams with some technical capability who want full control over dashboard design.
Google Looker Studio — Free but real-time capabilities are limited. Most data sources refresh every 12-24 hours unless you set up complex custom connectors. Best for: budget-conscious teams okay with near-real-time (hourly) instead of truly real-time.
The Psychological Impact of Real-Time Visibility
There’s an underrated benefit to real-time dashboards beyond just having current data: they change team behavior.
When metrics update instantly, people feel more connected to the business. A support team that sees customer satisfaction scores update in real time becomes more attentive. A marketing team watching live campaign performance makes faster optimizations. Sales teams monitoring daily pipeline movement stay more focused on closing deals.
The feedback loop tightens. Instead of waiting until Friday’s report to see if the week was successful, you know by Tuesday afternoon whether you’re on track. This enables course correction mid-week instead of post-mortem analysis after it’s too late.
One e-commerce founder described it as “the difference between driving with GPS vs. using a paper map you check once an hour.” Real-time dashboards don’t just inform you — they guide you.
Frequently Asked Questions
Is real-time tracking expensive?
Not anymore. Tools like Pulse AI include real-time tracking in their base plans (starting free, paid plans from $30-100/month). The infrastructure cost has dropped dramatically as streaming data architectures have matured. Enterprise tools can cost $500-2000/month, but small businesses don’t need enterprise features to get real-time visibility.
Do I need a technical person to set up real-time dashboards?
No. Modern platforms handle the streaming architecture automatically. You connect your data sources (Shopify, Google Analytics, etc.) with a few clicks, select your metrics, and the dashboard starts updating in real time. The complexity is abstracted away — you interact with a simple interface.
Won’t real-time data distract my team from deep work?
Only if you let it. The key is smart notifications. Don’t make people stare at a live dashboard all day — configure alerts so the system notifies them only when something requires attention. Treat it like a smoke detector: always monitoring, rarely alarming.
What happens if my real-time dashboard loses connection to a data source?
Good platforms detect this and alert you. They’ll show “Last updated 15 minutes ago” or “Connection issue detected” so you know the data is stale. The dashboard doesn’t show incorrect data — it shows the last known state and flags that it’s not current. You can usually resolve connection issues by re-authenticating the data source.