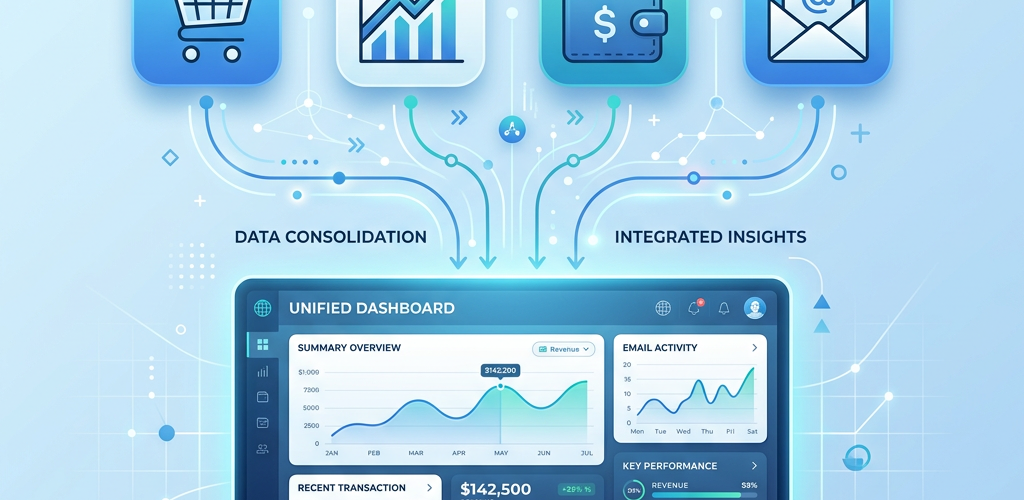
If your business data is spread across Shopify, QuickBooks, Google Analytics, HubSpot, Stripe, and five other tools, you already know the pain: no single view of your business, hours wasted switching between tabs, and reports that never quite match up because each tool calculates metrics differently.
The solution is a unified dashboard — one place where all your business data comes together. In 2026, this is genuinely achievable for small businesses without any coding or data engineering. Here’s exactly how to do it.
Why Your Data Is Scattered (And Why It Matters)
The average small business uses 37 different SaaS tools (Productiv, 2025). Each one holds a piece of your business picture: revenue in Shopify, expenses in QuickBooks, marketing performance in Google Analytics, customer relationships in HubSpot, payments in Stripe, support tickets in Zendesk.
The problem isn’t just inconvenience. Data silos cause real business damage:
Slow decision-making: When you need to answer “are we profitable on customers from paid search?”, you have to export from three different tools, merge in Excel, and pray the date ranges match. That takes hours for a question that should take seconds.
Missed insights: The most valuable business insights come from cross-referencing data. “Customers who come from organic search have 3x higher lifetime value than paid search customers” — you’ll never discover this if your marketing and revenue data live in separate tools.
Inconsistent metrics: Each tool calculates “revenue” slightly differently. Shopify includes refunds, Stripe doesn’t. QuickBooks uses accrual basis, your dashboard uses cash basis. Without a unified source of truth, every meeting starts with arguing about which number is right.
Three Ways to Consolidate Your Data
Option 1: AI Analytics Platform with Built-In Integrations (Recommended)
The fastest path for small businesses. Platforms like Pulse AI come with pre-built connectors for common business tools — you authorize access, and data flows in automatically.
Pros: Set up in minutes, not weeks. No technical skills required. AI automatically understands relationships between data sources. Built-in dashboards and natural language querying.
Cons: Limited to the integrations the platform supports. Less customization than a custom data warehouse.
Best for: Small businesses using mainstream SaaS tools (Shopify, QuickBooks, Google Analytics, HubSpot, Stripe, etc.) who want to be up and running today.
Cost: $50-$500/month depending on the platform.
Option 2: Integration Platform (Zapier, Make, Fivetran)
Use a middleware tool to sync data between your tools and a central database or spreadsheet.
Pros: Works with almost any tool that has an API. Highly customizable data flows. Can handle complex transformation logic.
Cons: Requires setup and ongoing maintenance. Can get expensive at scale (Zapier charges per task). Still need a separate tool for visualization and analysis. Data quality issues if integrations break.
Best for: Businesses with unusual tool stacks or complex data transformation needs.
Cost: $20-$500/month for the integration platform, plus a BI tool for visualization.
Option 3: Data Warehouse (BigQuery, Snowflake)
The enterprise approach: centralize all data in a cloud data warehouse, then connect a BI tool on top.
Pros: Maximum flexibility. Handles any data volume. Full control over data modeling. Best for complex analytics and machine learning.
Cons: Requires a data engineer to set up and maintain. Takes weeks to months, not days. Expensive ($500-$5,000+/month). Overkill for most small businesses.
Best for: Companies with 100+ employees, dedicated data teams, and complex analytics requirements.
Step-by-Step: Setting Up a Unified Dashboard in Under 30 Minutes
Here’s the practical walkthrough using the recommended approach (AI analytics platform):
Step 1: Choose your platform and sign up (2 minutes). For small businesses, we recommend Pulse AI because of its SMB-focused integrations and AI-powered analysis. ThoughtSpot and Power BI are alternatives if you have bigger budgets or specific ecosystem requirements.
Step 2: Connect your revenue source first (5 minutes). Your e-commerce platform (Shopify, WooCommerce, BigCommerce) or payment processor (Stripe, Square) is the most important data source. Connect it first. You’ll typically click “Connect,” authorize with OAuth, and data begins syncing immediately.
Step 3: Add your financial data (5 minutes). Connect QuickBooks, Xero, or your accounting software. This gives you expense tracking, profit margins, and cash flow data alongside your revenue.
Step 4: Connect marketing sources (5 minutes). Google Analytics, Google Ads, Meta Ads, HubSpot — connect whichever marketing tools you use. This enables the cross-source insights (like marketing ROI and customer acquisition cost by channel) that make unified dashboards so powerful.
Step 5: Ask your first cross-source question (2 minutes). Now try something you couldn’t do before: “What is my customer acquisition cost by marketing channel, and what is the average lifetime revenue of customers from each channel?” This question requires data from your marketing platform AND your revenue platform — and the AI analytics tool answers it by combining both sources automatically.
Step 6: Set up automated monitoring (5 minutes). Configure alerts for the metrics that matter most: revenue dropping below a threshold, marketing spend exceeding budget, customer churn increasing, etc. The AI will watch these 24/7 and notify you when something needs attention.
Common Integration Challenges (And How to Solve Them)
Different date formats and timezones: Most AI analytics platforms handle this automatically. If you notice discrepancies, check that all your source tools are set to the same timezone.
Duplicate data: When the same transaction appears in multiple systems (e.g., a Shopify order that also appears in Stripe), good analytics platforms deduplicate automatically. If you see inflated numbers, check for this.
Historical data limits: Some API integrations only pull recent data (last 90 days, last year). If you need historical analysis, check the data range available for each integration and supplement with CSV imports if needed.
Data refresh frequency: Real-time vs. daily sync depends on the tool and integration. For most small business decisions, daily sync is sufficient. If you need real-time data (e.g., flash sales monitoring), confirm the refresh frequency before committing to a platform.
Frequently Asked Questions
Can I connect custom or industry-specific tools?
Most AI analytics platforms support CSV/Excel imports for tools without native integrations. Some also offer API connectors or Zapier integration for custom data sources. Check the integration catalog of your chosen platform before signing up.
What happens to my data if I switch analytics platforms?
Your source data stays in your original tools (Shopify, QuickBooks, etc.) — the analytics platform just reads from them. If you switch platforms, you reconnect your sources to the new tool. No data is lost because the analytics platform doesn’t store your primary data.
How many data sources can I connect?
This varies by platform and pricing tier. Most AI analytics tools for small businesses support 5-20 data source connections. Check if the specific tools you use are supported before committing.


