The Real Cost of Looking at Yesterday’s Data
Most businesses make decisions based on data that’s hours, days, or even weeks old. The weekly sales report tells you what happened last week — not what’s happening right now. Monthly financial reviews show trends that started 30 days ago. Quarterly business reviews are essentially autopsies.
In fast-moving markets, this lag is expensive. A pricing error that runs for 48 hours before anyone notices it in a report can cost thousands. A marketing campaign that’s burning budget on a broken landing page won’t be caught until someone checks the numbers next Monday. A supply chain disruption that shows up in next month’s inventory report has already caused stockouts.
According to Forrester Research, companies that use real-time analytics are 2.7x more likely to report significant revenue growth compared to those relying on batch reporting. The data is clear: speed of insight directly impacts business outcomes.
What “Real-Time” Actually Means for Business Dashboards
Real-time doesn’t always mean millisecond latency. For most business applications, there are three tiers of data freshness:
True real-time (sub-second). Needed for fraud detection, trading platforms, and IoT monitoring. Data streams continuously with no perceptible delay. Most businesses don’t need this level.
Near real-time (minutes). Perfect for most business dashboards. Data refreshes every 1-15 minutes. Enough to catch issues within the hour and make intra-day decisions. This is what platforms like Pulse AI deliver for standard business metrics.
Batch with alerts (hourly). Data updates hourly, but AI monitors for anomalies and sends immediate alerts when something significant changes. A good balance of cost and timeliness for less critical metrics.
Five Scenarios Where Real-Time Dashboards Pay for Themselves
1. E-commerce flash sales and promotions. When you run a flash sale, you need to see traffic, conversion rates, cart abandonment, and inventory levels in real time. If the checkout page breaks under load, you need to know in minutes — not the next day.
2. Digital marketing campaign launches. The first 24 hours of a campaign determine its trajectory. Real-time dashboards let you see cost-per-click, conversion rates, and ROAS as they develop, enabling same-day optimization instead of waiting for end-of-week analysis.
3. SaaS user engagement monitoring. If a new feature deployment causes a spike in errors or a drop in engagement, your product team needs to know immediately. Real-time dashboards correlate deployment events with user behavior metrics.
4. Customer support capacity. Ticket volume spikes need immediate response. Real-time dashboards that show incoming ticket velocity, average response time, and agent utilization help support managers allocate resources before queues get out of control.
5. Revenue and cash flow tracking. For businesses with high transaction volumes, real-time revenue tracking enables accurate daily forecasting and immediate detection of payment processing issues.
How AI Makes Real-Time Dashboards Practical
Real-time dashboards used to require expensive data engineering infrastructure — streaming pipelines, real-time databases, custom-built monitoring systems. AI has dramatically lowered this barrier.
Automatic data pipeline creation. AI BI platforms can automatically set up data connections and refresh schedules without requiring data engineering expertise. Connect your database, and the platform handles the rest.
Smart refresh scheduling. AI determines which metrics need real-time updates and which can refresh hourly, optimizing system resources without sacrificing timeliness where it matters.
Intelligent alerting. Instead of setting manual alert thresholds (which require knowing what “normal” looks like), AI learns your data patterns and alerts you when deviations are statistically significant.
Building Your Real-Time Dashboard Strategy
Start by identifying your “golden metrics.” Not every metric needs real-time updates. Pick the 5-10 metrics that, if they changed significantly, you’d want to know within the hour. Revenue, conversion rate, error rate, and customer satisfaction are common candidates.
Set up anomaly detection first, dashboards second. Even before building a real-time dashboard, configure AI alerts for your golden metrics. This gives you 80% of the benefit with minimal setup.
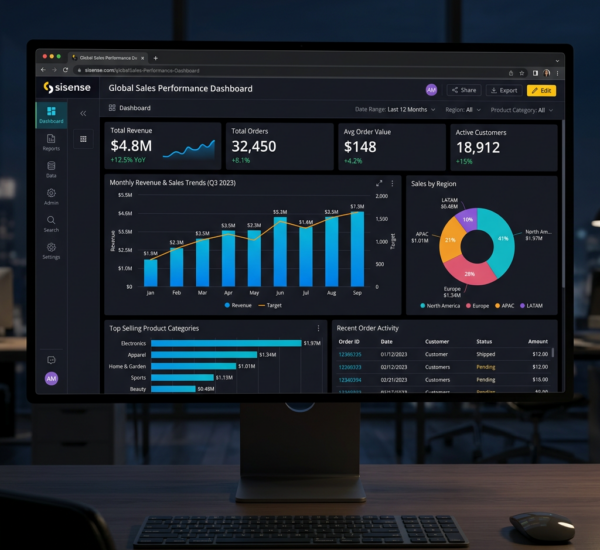
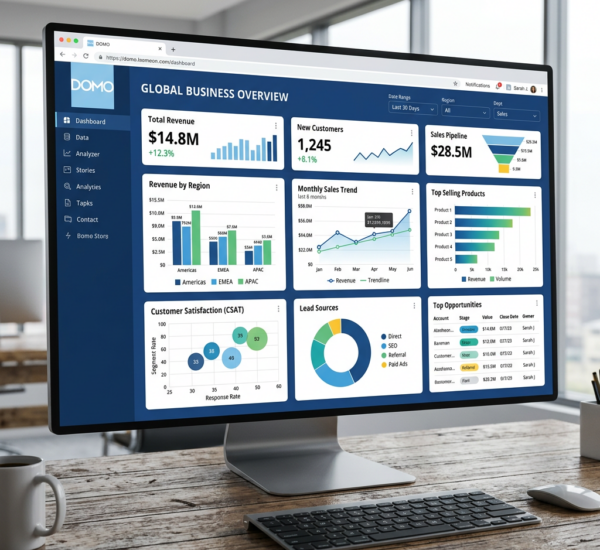
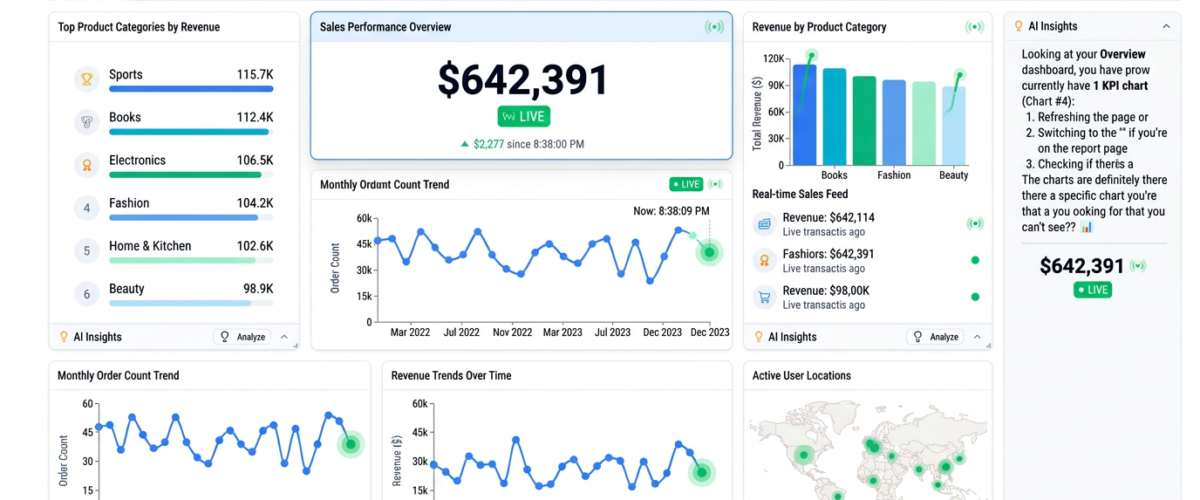
Design for glanceability. Real-time dashboards should communicate status at a glance. Use KPI cards with clear trend indicators (up/down arrows, green/red colors), sparklines for trends, and reserve detailed charts for drill-down.
Frequently Asked Questions
How much does real-time data infrastructure cost?
With modern AI BI platforms, the cost of real-time dashboards is included in the platform subscription. You don’t need separate streaming infrastructure. Pulse AI, for example, provides near real-time updates as part of its standard offering.
Will real-time dashboards slow down my database?
Good AI BI platforms use read replicas, caching, and smart query optimization to minimize database load. They don’t run heavy queries against your production database every second — they use efficient incremental updates.
Do I need to change my data sources for real-time?
Usually not. Most modern databases (PostgreSQL, MySQL, BigQuery), SaaS APIs (Salesforce, HubSpot, Stripe), and analytics platforms (Google Analytics) already support frequent data access. The AI BI platform handles the connection and refresh logic.