When Spreadsheets Stop Working
Spreadsheets are how most businesses start with data. They’re flexible, familiar, and free. For early-stage companies, a well-organized Google Sheet can track revenue, customers, inventory, and marketing metrics perfectly well. But there’s a tipping point — and most growing teams hit it sooner than they expect.
You know you’ve hit the spreadsheet ceiling when: multiple people need to update the same data and you’re dealing with version conflicts; your “master spreadsheet” takes 30+ seconds to load; you spend more time maintaining formulas than analyzing results; different team members have different numbers for the same metric because they’re using different sheets; or you can’t answer a simple question without 20 minutes of filtering and pivot-tabling.
These aren’t signs of a bad spreadsheet — they’re signs your business has outgrown spreadsheets. The question isn’t whether to migrate to a proper analytics platform, but how to do it without disrupting operations.
The Migration Framework: Four Phases
Phase 1: Audit Your Current Spreadsheet Ecosystem (Week 1)
Before migrating anything, you need to understand what you’re working with. Map out every spreadsheet your team uses regularly. For each one, document: what data it contains, who maintains it, how often it’s updated, who uses the output, and what decisions it informs.
You’ll likely find three categories: Core operational sheets (daily use, critical data), periodic reports (weekly/monthly summaries), and ad-hoc analysis (one-time projects). Focus your migration on the first two. Ad-hoc analysis can stay in spreadsheets — that’s what they’re good at.
Phase 2: Set Up Your AI Dashboard Platform (Week 2)
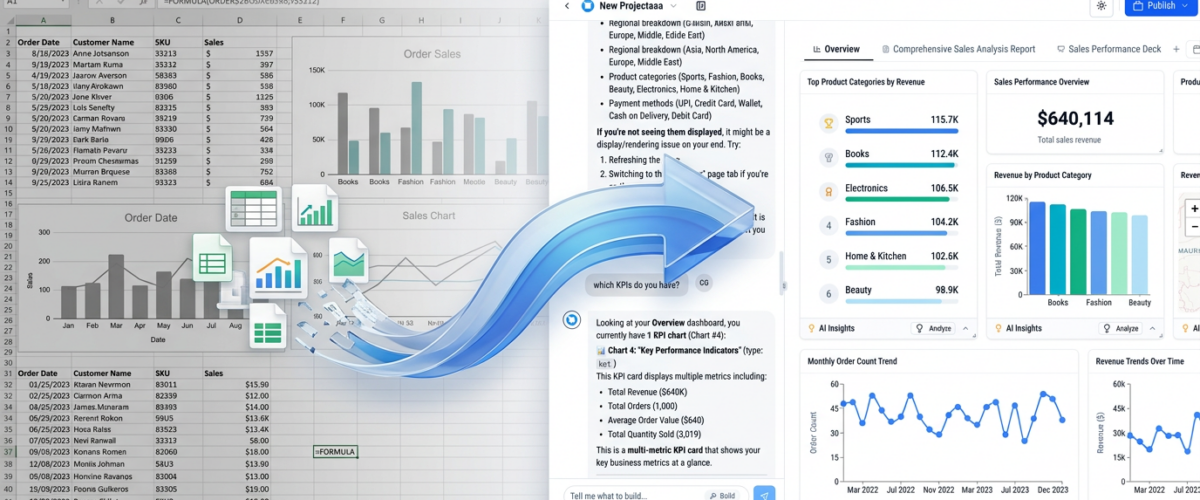
Choose an AI BI platform that can connect to your existing data sources. Pulse AI is designed specifically for teams making this transition — it connects to databases, Google Sheets, and common business tools, and lets you build dashboards by simply describing what you want in plain English.
Start by connecting your primary data source. If your spreadsheets pull from a database, connect the database directly. If your spreadsheets ARE the data source, connect them as data sources (most AI BI tools can read Google Sheets and Excel files directly).
Phase 3: Recreate Your Top 5 Reports as Dashboards (Weeks 3-4)
Don’t try to migrate everything at once. Pick your five most-used reports and recreate them as AI dashboards. With natural language querying, this is often as simple as describing what the report shows: “Create a dashboard showing monthly revenue, top products by sales, customer acquisition by channel, and weekly order trends.”
Run the new dashboards alongside your existing spreadsheets for at least one reporting cycle. Compare the numbers. Confirm they match. This parallel-run period builds trust and catches any data connection issues before you deprecate the old reports.
Phase 4: Deprecate Spreadsheets and Expand (Ongoing)
Once your team trusts the new dashboards, stop updating the spreadsheet versions. Don’t delete them — archive them for reference. Then gradually migrate more reports, adding new dashboards for questions you could never easily answer with spreadsheets.
Common Migration Challenges (and How to Solve Them)
“My team is comfortable with spreadsheets and resistant to change.” Don’t force it. Show, don’t tell. When a team member asks a question that would take 20 minutes in a spreadsheet, answer it in 30 seconds with the AI dashboard. Let the superiority of the tool create demand.
“Our spreadsheets have complex formulas and custom calculations.” Map out the business logic in your spreadsheet formulas. Most AI BI platforms support custom calculated fields. If a specific calculation is too complex, you may need to implement it in your database or as a data transformation step.
“We don’t have a real database — everything IS in spreadsheets.” That’s okay. Start by connecting your spreadsheets directly to the AI BI platform. Over time, you can move critical data into a proper database (many platforms help with this transition too).
What You Gain After Migration
Single source of truth. No more “which version of the spreadsheet is correct?” Everyone sees the same live dashboard pulling from the same data source.
Self-serve analytics. Team members can ask their own questions without waiting for someone to build a report. Natural language querying means no spreadsheet skills required.
Real-time data. Instead of manually updating spreadsheets, dashboards refresh automatically. The number you see is always current.
AI-powered insights. The AI doesn’t just display your data — it spots trends, flags anomalies, and suggests analyses you wouldn’t have thought to do in a spreadsheet.
Frequently Asked Questions
How long does the full migration take?
For most teams, the core migration (top 5-10 reports) takes 2-4 weeks. Full migration from all spreadsheet-based reporting can take 1-3 months, depending on complexity. But you start getting value from day one — each migrated report saves time immediately.
Will I still need spreadsheets for anything?
Yes, likely. Spreadsheets remain excellent for ad-hoc analysis, quick calculations, collaborative data entry, and one-off projects. The goal isn’t to eliminate spreadsheets — it’s to stop using them as your primary reporting and analytics infrastructure.
What if our data quality is poor?
Migrating to a dashboard platform often reveals data quality issues that were hidden in spreadsheets (inconsistent naming, missing fields, duplicate records). This is actually a benefit — you can’t fix problems you can’t see. Most AI BI platforms include data profiling features that help identify and resolve quality issues.