Running a Shopify store means juggling orders, inventory, marketing, and customer data across multiple tools. Shopify’s built-in analytics are helpful but limited. You can’t combine Shopify data with Facebook Ads, Google Analytics, or email marketing in one view.
The solution: Connect Shopify to a real dashboard. See your revenue, orders, inventory, and marketing performance in one place. Track what’s selling, what’s not, and where your traffic comes from. Make faster, better decisions.
Pulse AI makes this simple. Connect Shopify in 3 clicks. Choose the metrics you care about. Build a dashboard in minutes, not days. No coding. No complexity.
This guide shows you the best Shopify dashboard examples, essential metrics every store should track, and how to build dashboards that drive better e-commerce decisions.
Why Connect Shopify to a Dashboard?
Shopify’s built-in analytics are functional, but they have major limitations:
Limited integrations. Shopify shows store data (orders, revenue, inventory) but not marketing data (ad spend, email performance, website traffic). You need to combine Shopify with other tools to see the full picture.
No custom visualizations. Shopify reports are pre-built. You can’t create custom dashboards tailored to your business.
Hard to share. Only Shopify users can view analytics. If your marketing team, accountant, or investors don’t have Shopify access, they can’t see the data.
No real-time updates outside Shopify. You have to log into Shopify to see data. No automated reports or live dashboards.
A modern BI dashboard fixes all of this. You choose the metrics, visualize them clearly, and share with anyone — Shopify login not required.
Key Shopify Metrics to Track in Your Dashboard
Focus on metrics that drive e-commerce decisions:
Revenue & Sales Metrics
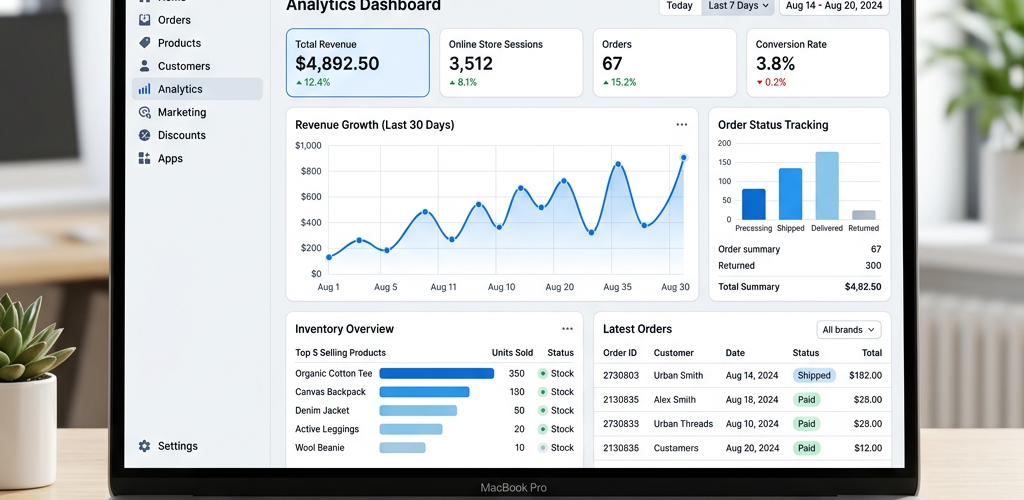
Total Revenue: Total sales (today, this week, this month). Shows if your store is growing.
Number of Orders: Total orders placed. Shows transaction volume.
Average Order Value (AOV): Revenue ÷ Orders. Shows how much each customer spends on average.
Revenue by Product: Which products drive the most revenue?
Revenue by Traffic Source: Which channels (organic, paid, email, social) drive sales?
Revenue Growth: Month-over-month or year-over-year revenue change.
Inventory Metrics
Stock Levels by Product: Current inventory for each product.
Low Stock Alerts: Products below reorder threshold.
Out-of-Stock Products: Products with zero inventory (lost sales opportunities).
Best-Selling Products: Products with highest sales velocity.
Slow-Moving Inventory: Products that aren’t selling.
Inventory Turnover Rate: How quickly inventory sells.
Customer Metrics
New Customers: First-time buyers.
Returning Customers: Repeat buyers.
Customer Lifetime Value (LTV): Average revenue per customer over their lifetime.
Repeat Purchase Rate: Percentage of customers who buy again.
Time Between Purchases: Average days between first and second purchase.
Conversion & Traffic Metrics
Conversion Rate: Orders ÷ Visitors. Shows how well your store converts traffic.
Traffic by Source: Where visitors come from (organic search, paid ads, social, email, direct).
Cart Abandonment Rate: Percentage of carts abandoned before checkout.
Checkout Abandonment Rate: Percentage of checkouts abandoned before purchase.
Marketing Metrics (when combined with ad platforms)
Ad Spend: Total spent on Google Ads, Facebook Ads, etc.
Customer Acquisition Cost (CAC): Ad spend ÷ New customers.
Return on Ad Spend (ROAS): Revenue ÷ Ad spend.
Cost Per Click (CPC): Ad spend ÷ Clicks.
Conversion Rate by Channel: Which channels convert best?
Most Shopify stores only need 15-20 of these metrics. Pulse AI lets you pick exactly what matters.
Top 5 Shopify Dashboard Examples
1. Shopify Revenue Dashboard
Best for: Store owners tracking daily sales performance
Metrics to track:
- Total revenue (today, this week, this month, this year)
- Number of orders
- Average order value (AOV)
- Revenue by product
- Revenue by traffic source
- Revenue trends over time
Why it works: You see immediately if revenue is up, down, or flat. If a product stops selling or a traffic source dries up, you know within hours.
How Pulse AI makes it simple: Connects to Shopify. Pulls order data automatically. Updates in real-time.
2. Shopify Inventory Dashboard
Best for: Operations teams managing stock levels
Metrics to track:
- Stock levels by product
- Low stock alerts (products below reorder threshold)
- Out-of-stock products
- Best-selling products (by units sold)
- Slow-moving inventory
- Inventory turnover rate
Why it works: Stockouts kill sales. Overstocking kills cash flow. This dashboard helps you order the right amount at the right time.
How Pulse AI makes it simple: Syncs Shopify inventory data. Alerts when products hit reorder points.
3. Shopify Marketing Performance Dashboard
Best for: Marketing managers tracking ad ROI
Metrics to track:
- Total ad spend (Google Ads, Facebook Ads, TikTok, etc.)
- Revenue by traffic source
- Customer acquisition cost (CAC) by channel
- Return on ad spend (ROAS) by channel
- Conversion rate by channel
- New customers by channel
Why it works: See which marketing channels are profitable and which are burning cash. If Facebook ROAS is 5x but Google ROAS is 1.5x, shift budget to Facebook.
How Pulse AI makes it simple: Connects Shopify (for revenue) and ad platforms (for spend). Calculates CAC and ROAS automatically.
4. Shopify Customer Dashboard
Best for: Growth teams optimizing customer lifetime value
Metrics to track:
- New customers
- Returning customers
- Customer lifetime value (LTV)
- Repeat purchase rate
- Time between purchases
- Average orders per customer
Why it works: Acquiring customers is expensive. This dashboard shows if customers are coming back and how much they’re worth over time.
How Pulse AI makes it simple: Analyzes Shopify order history. Calculates LTV, repeat rates, and purchase frequency automatically.
5. Shopify Conversion Funnel Dashboard
Best for: CRO teams optimizing the funnel
Metrics to track:
- Website visitors
- Conversion rate (visitors → orders)
- Add-to-cart rate
- Cart abandonment rate
- Checkout abandonment rate
- Conversion rate by device (mobile vs. desktop)
- Conversion rate by traffic source
Why it works: Shows exactly where customers drop off. If 1,000 visitors convert to 10 orders (1% conversion) but competitors convert at 3%, you’re leaving money on the table.
How Pulse AI makes it simple: Combines Google Analytics (traffic) with Shopify (orders). Calculates conversion rates automatically.
How to Connect Shopify to Pulse AI (Step-by-Step)
Connecting Shopify to Pulse AI takes 5 minutes. No coding. No API keys.
Step 1: Log into Pulse AI
Go to usepulseai.com and sign in.
Step 2: Add Shopify as a Data Source
Click “Add Data Source” → Select “Shopify” → Authenticate with your Shopify store.
Pulse AI uses OAuth, so you just log in to Shopify and click “Allow.” It connects instantly.
Step 3: Choose Data to Sync
Select which Shopify data you want to pull: Orders, Products, Customers, Inventory, etc.
Most stores start with Orders (for revenue) and Products (for inventory).
Step 4: Select Metrics
Choose which metrics you want to track. Pulse AI suggests the most common ones (revenue, orders, AOV, inventory levels), but you can add or remove any metric.
Step 5: Build Your Dashboard
Drag and drop visualizations onto your dashboard:
- Line charts for revenue trends
- Bar charts for top products
- Tables for inventory levels
- Pie charts for revenue by traffic source
Customize colors, labels, and time ranges.
Step 6: Set Refresh Frequency
Choose how often Pulse AI syncs with Shopify. Real-time, hourly, or daily.
Step 7: Share
Send a link to your team (Shopify login not required), embed in Slack, or schedule automated email reports.
Total time: 5-10 minutes.
Use Cases: What You Can Do with a Shopify Dashboard
Use Case 1: Track Daily Revenue Performance
See how much revenue your store generates today, this week, and this month. Spot trends early.
Metrics to track:
- Total revenue (today, this week, this month)
- Number of orders
- Average order value (AOV)
- Revenue by product
- Revenue trends over time
Why it works: Instantly see if revenue is growing or declining. If a product stops selling, you know immediately.
Use Case 2: Monitor Inventory Levels
Never oversell or run out of best sellers. Track stock levels and get alerts when inventory is low.
Metrics to track:
- Stock levels by product
- Low stock alerts
- Out-of-stock products
- Best-selling products (by units sold)
- Days of inventory remaining
Why it works: Stockouts kill sales. This dashboard helps you reorder before you run out.
Use Case 3: Analyze Marketing ROI
See which marketing channels (Google Ads, Facebook Ads, email) drive revenue and which burn cash.
Metrics to track:
- Revenue by traffic source
- Ad spend by channel
- Customer acquisition cost (CAC) by channel
- Return on ad spend (ROAS) by channel
- Conversion rate by channel
Why it works: Focus budget on channels that deliver ROI. If Facebook ROAS is 5x but Google ROAS is 1.5x, shift budget.
Use Case 4: Optimize Conversion Rates
Track where visitors drop off in your funnel. Fix bottlenecks to increase revenue without increasing traffic.
Metrics to track:
- Website visitors
- Conversion rate (visitors → orders)
- Add-to-cart rate
- Cart abandonment rate
- Checkout abandonment rate
Why it works: Even a 5% improvement in conversion can significantly boost revenue. If cart abandonment is 70%, focus on cart recovery emails.
Use Case 5: Track Customer Lifetime Value
See if customers are coming back and how much they’re worth over time.
Metrics to track:
- Customer lifetime value (LTV)
- Repeat purchase rate
- Average orders per customer
- Time between purchases
Why it works: Acquiring customers is expensive. If LTV is high, you can afford higher CAC. If LTV is low, focus on retention.
Shopify Dashboards: Pulse AI vs. Other Tools
| Feature | Pulse AI | Shopify Analytics | Google Analytics | Tableau | Power BI | |———|———-|——————|——————|———|———-| | Setup time | 5-10 minutes | Built-in | Hours | Days | Days | | Combines Shopify with other data | ✅ Yes (ads, analytics, email) | ❌ Shopify only | ⚠️ Limited | ✅ Yes | ✅ Yes | | Real-time updates | ✅ Yes | ✅ Yes | ⚠️ 24-48hr delay | ✅ Yes | ✅ Yes | | Revenue attribution | ✅ Automatic | ⚠️ Basic | ⚠️ Manual setup | ✅ Yes | ✅ Yes | | Shareable outside Shopify | ✅ Yes | ❌ Requires Shopify login | ✅ Yes | ✅ Yes | ✅ Yes | | Pricing | From $29/month | Included (limited) | Free (limited) | From $70/user/month | From $10/user/month | | Best for | Teams who want results fast | Basic store analytics | Traffic analysis | Data teams | Microsoft-heavy orgs |
Shopify Analytics is included but limited to Shopify data. You can’t combine it with ad platforms, Google Analytics, or email tools.
Google Analytics tracks website traffic but doesn’t integrate deeply with Shopify revenue data.
Tableau and Power BI are powerful but require technical expertise and take days to set up.
Pulse AI gives you enterprise e-commerce analytics with zero complexity. Connect Shopify in minutes, not days.
Pulse AI connects Shopify, Google Analytics, ad platforms, and email tools automatically. Track revenue, inventory, and marketing in real-time. Try Pulse AI free.
Frequently Asked Questions
How do you connect Shopify to a dashboard?
Use a BI tool like Pulse AI that has a pre-built Shopify connector. Log in, authenticate with Shopify, select the data you want to sync (Orders, Products, Customers, Inventory), choose metrics, and build visualizations. With Pulse AI, this takes 5-10 minutes.
What metrics should a Shopify dashboard include?
Focus on revenue (total revenue, orders, AOV), inventory (stock levels, best sellers, out-of-stock items), and marketing (CAC, ROAS, conversion rate). Choose 15-20 KPIs that drive decisions.
Can you combine Shopify with Google Analytics and Facebook Ads in one dashboard?
Yes. Pulse AI lets you combine Shopify (revenue, orders, inventory), Google Analytics (traffic), Facebook Ads (ad spend), and other tools in one dashboard. This shows the full e-commerce picture.
How often should a Shopify dashboard update?
Real-time for revenue and orders (especially during sales or campaigns). Hourly for inventory. Daily for customer metrics like LTV. Pulse AI lets you set custom refresh rates.
What’s better: Shopify Analytics or Pulse AI for Shopify dashboards?
Shopify Analytics is included and works for basic reporting, but it’s limited to Shopify data. Pulse AI is better if you need to combine Shopify with ad platforms, Google Analytics, or email tools, or if you want custom dashboards.
Can you track Shopify revenue by traffic source?
Yes, if you’ve set up UTM parameters on your marketing campaigns. Shopify and Google Analytics track traffic sources, and Pulse AI combines that with Shopify order data to show revenue by source.
Do you need coding skills to connect Shopify to a dashboard?
No. Tools like Pulse AI use OAuth authentication (just click “Allow”). No API keys, no coding, no technical setup required.
Can you share Shopify dashboards with people who don’t have Shopify access?
Yes, with Pulse AI. Anyone with the dashboard link can view it — no Shopify login required. Shopify’s built-in analytics require a Shopify login.
Conclusion: Turn Shopify Data into Decisions with Pulse AI
Shopify holds critical e-commerce data, but its analytics are limited to store metrics. Building a custom dashboard brings together Shopify, Google Analytics, ad platforms, and email tools in one view.
Most dashboard tools are slow to set up, require technical skills, or cost a fortune.
Pulse AI is different. Connect Shopify in 3 clicks. Choose the metrics that matter. Build a dashboard in minutes. Share with anyone — Shopify login not required. No coding. No complexity.
Stop juggling five different analytics tools. Start making better e-commerce decisions.