Why Manual Reporting Is Costing Your Business More Than You Think
Every week, thousands of analysts spend hours copying data from one system to another, formatting spreadsheets, updating charts, and emailing PDF reports that are already outdated by the time anyone reads them. According to McKinsey’s research, knowledge workers spend roughly 20% of their time searching for and gathering information — much of it for reporting purposes.
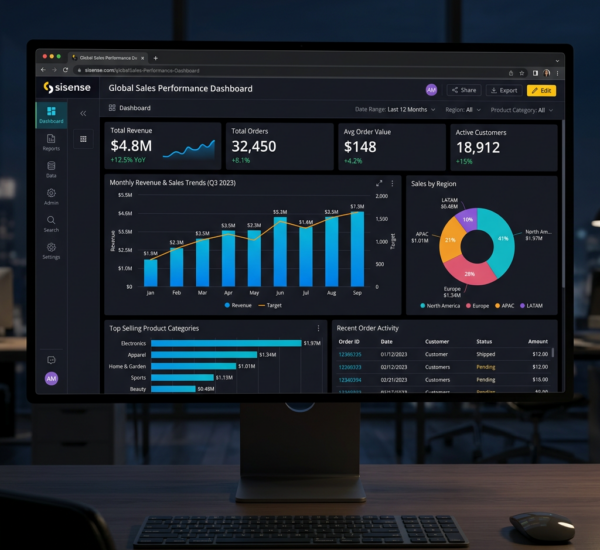
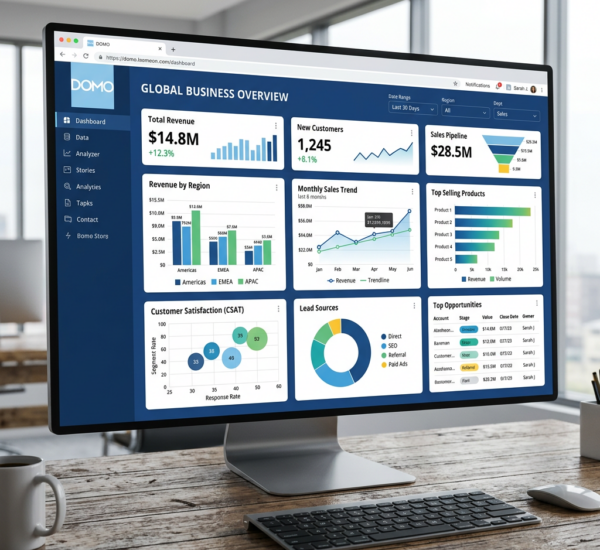
AI-powered reporting tools are changing this equation entirely. Instead of humans building reports, AI systems now monitor data streams in real time, detect patterns worth reporting on, generate visualizations automatically, and deliver insights directly to the people who need them.
What AI Reporting Actually Looks Like in Practice
The shift from manual to AI-driven reporting isn’t just about automation — it’s a fundamental change in how businesses interact with their data. Traditional reporting follows a pull model: someone decides they need a report, requests it, waits for it to be built, reviews it, and eventually acts on it. AI reporting flips this to a push model: the system continuously analyzes data and pushes relevant insights to decision-makers the moment they become actionable.
Here’s what that looks like in practice. A sales manager used to wait until Monday morning for the weekly sales report. Now, an AI dashboard flags a sudden drop in conversion rates on Thursday afternoon and sends an alert with context: “Conversion rate dropped 15% in the last 48 hours. Primary driver: checkout page load time increased from 2.1s to 4.8s.”
That’s not just faster reporting — it’s a completely different capability. The AI didn’t just present numbers; it identified the anomaly, traced the root cause, and delivered actionable context.
The Hidden Costs of Manual Reporting
Decision latency. When reports take days to produce, decisions are made on stale data. A Harvard Business Review study found that 72% of business leaders feel they miss opportunities because insights arrive too late.
Error rates. Manual data handling introduces errors at every step — copy-paste mistakes, formula errors, version control issues. Research estimates that 88% of spreadsheets contain at least one error. When business decisions are built on flawed data, the downstream costs can be enormous.
Opportunity cost. Every hour an analyst spends formatting a chart is an hour they’re not spending on actual analysis — finding patterns, testing hypotheses, generating strategic insights.
How AI Reporting Tools Work
Modern AI reporting platforms like Pulse AI combine several capabilities that together replace the manual reporting workflow:
Automated data integration. AI tools connect directly to your data sources — databases, CRMs, marketing platforms — and continuously sync data. No more manual exports or CSV uploads.
Natural language querying. Instead of writing SQL or building pivot tables, users simply ask questions in plain English: “What were our top-selling products last quarter?” The AI translates these into queries and generates appropriate visualizations automatically.
Intelligent visualization. AI chooses the right chart type based on the data structure. Time series data gets line charts. Categorical comparisons get bar charts. Geographic data gets maps.
Anomaly detection and proactive alerts. Rather than waiting for someone to notice something unusual, AI continuously monitors metrics and flags statistically significant changes immediately.
Real Results: What Companies See After Switching
Time savings are dramatic. Tasks that took analysts 4-8 hours per week drop to minutes. Platforms like Pulse AI can generate a complete dashboard from a single natural language request in under 60 seconds.
Report freshness improves from days to real-time. Instead of weekly reporting cycles, dashboards update continuously. Decision-makers always see current data.
Analyst roles evolve. Rather than eliminating analyst positions, AI reporting transforms them. Analysts shift from data gathering to interpreting trends, designing experiments, and advising on strategy.
Getting Started: A Practical Migration Path
Phase 1: Identify your highest-frequency reports and automate them first with an AI dashboard tool.
Phase 2: Connect your core data sources (CRM, database, marketing platform).
Phase 3: Train your team on natural language querying with hands-on sessions.
Phase 4: Set up proactive alerts for your most critical metrics.
Frequently Asked Questions
Will AI reporting replace data analysts?
No — it transforms their role. AI handles repetitive data gathering and formatting. Analysts move to higher-value strategic work like building predictive models and advising leadership.
How accurate are AI-generated reports?
Generally more accurate than manual ones. AI eliminates copy-paste mistakes, formula errors, and version conflicts. Data comes directly from source systems with no human intermediary.
How long does it take to set up AI reporting?
Initial setup typically takes minutes to hours. Connect your data source and the AI can start generating dashboards immediately. Fine-tuning happens iteratively.