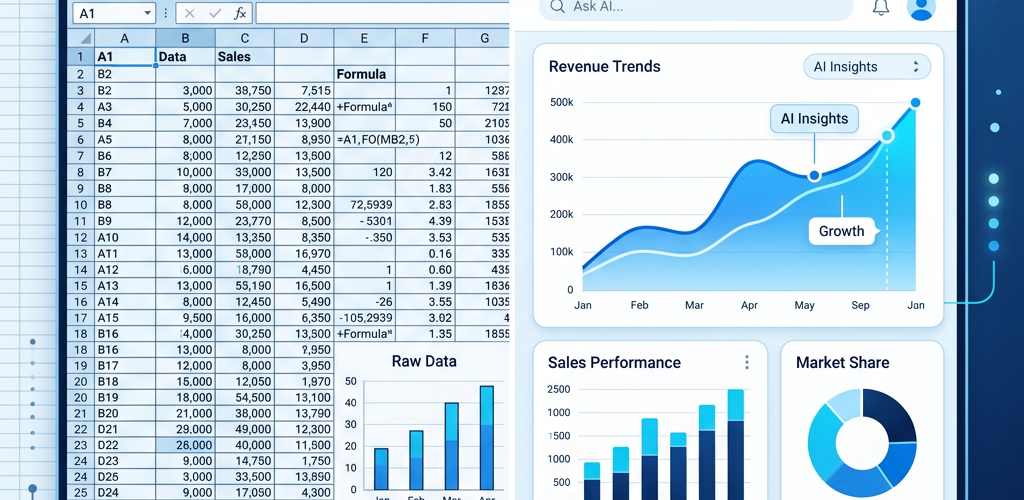
If you’re still building your monthly reports in Excel, you’re not alone. Over 750 million people use Excel worldwide, and for many businesses, it’s still the default tool for everything from tracking sales to forecasting revenue. But with AI analytics tools becoming genuinely usable in 2025-2026, the question everyone’s asking is: can AI actually replace Excel for business reporting?
The honest answer: yes, for most reporting tasks — and it’s not even close. But Excel still has legitimate advantages in specific scenarios. Here’s the full breakdown.
Where AI Analytics Beats Excel (Decisively)
Speed of insight
In Excel, generating a monthly sales report means: downloading data exports from multiple tools, cleaning and formatting the data, building pivot tables, creating charts, writing analysis, and formatting for presentation. This typically takes 2-8 hours depending on complexity.
With AI analytics, you say: “Generate a monthly sales report for February.” You get a complete report with visualizations, trend analysis, and AI-generated insights in under 60 seconds. That’s not an exaggeration — tools like Pulse AI generate presentation-ready reports in real time.
Real-time data
Excel reports are static snapshots. The moment you export data and build a report, it’s already outdated. If your manager asks “what are sales looking like today?” you have to go pull fresh data and rebuild.
AI analytics platforms connect directly to your live data sources. Your dashboards update in real-time. When someone asks about today’s numbers, the answer is always current — no manual refresh needed.
Error reduction
Studies consistently show that 88% of spreadsheets contain errors (Raymond Panko, University of Hawaii). Formula mistakes, copy-paste errors, broken references, and accidental overwrites are endemic to Excel-based reporting. One wrong cell reference can cascade through an entire financial model.
AI analytics eliminates this entire category of risk. The analysis is generated from source data programmatically — no manual formulas, no copy-paste, no broken references.
Accessibility
Excel proficiency is a genuine skill that takes months to develop. Pivot tables, VLOOKUP, conditional formatting, chart customization — these aren’t intuitive for most people. This creates bottlenecks: only the “Excel person” on the team can generate reports.
AI analytics democratizes data access. Anyone can type a question in plain English and get an answer. No formulas, no training, no Excel skills required.
Where Excel Still Wins
Ad-hoc calculations and modeling
Need to quickly model a pricing scenario? Build a custom financial projection with specific assumptions? Do a one-off calculation that doesn’t fit any standard report? Excel’s freeform grid is unbeatable for this. It’s essentially a visual programming environment where you can build anything.
Data manipulation and cleanup
When you need to manually fix, transform, or restructure messy data, Excel (and Google Sheets) is still the most intuitive tool. Find-and-replace, manual corrections, custom transformations — the spreadsheet interface is designed for hands-on data work.
Offline access and portability
An Excel file works anywhere — offline, on any computer, shared via email. No internet connection required, no subscription, no login. For situations where you need maximum portability and zero dependencies, a spreadsheet file is hard to beat.
Extreme customization
Excel lets you control every pixel of your report. Custom formatting, conditional colors, specific chart types, unusual layouts — if you have a very specific visual requirement, Excel gives you the granular control to achieve it (even if it takes hours).
The Hybrid Approach: What Smart Teams Do
The reality is that most businesses in 2026 shouldn’t choose AI analytics OR Excel — they should use both for what each does best:
Use AI analytics for: All recurring reports (weekly, monthly, quarterly). Real-time dashboards and KPI monitoring. Ad-hoc business questions (“What’s our customer retention rate by cohort?”). Automated alerts and proactive insights. Team-wide data access and self-service analytics.
Keep Excel for: One-off financial models and scenario planning. Quick personal calculations. Data cleanup and manual corrections. Custom templates with very specific formatting requirements. Sharing data externally where a file is more appropriate than a dashboard link.
How to Transition from Excel to AI Analytics
If you’re ready to move your reporting from Excel to AI analytics, here’s the practical path:
Week 1: Set up your AI analytics platform (we recommend Pulse AI for small businesses) and connect your core data sources. Don’t stop using Excel yet — run both in parallel.
Week 2-3: Recreate your most time-consuming recurring report in the AI tool. Compare the output with your Excel version. You’ll likely find the AI version is faster to produce and catches insights you missed.
Week 4: Start directing ad-hoc questions to the AI tool first. “What were sales by region last quarter?” — ask the AI before opening Excel. Track how often the AI gives you a faster, better answer.
Month 2: By now, you’ll have a clear picture of which reports and analyses work better in AI vs Excel. Formalize the split. Automate all recurring reports in the AI tool. Keep Excel for the specific use cases where it genuinely adds value.
The Cost Comparison
Excel (Microsoft 365) costs $6-$22 per user per month. But the real cost isn’t the software — it’s the time. If your team spends 10 hours per week on Excel-based reporting (common for growing businesses), that’s 520 hours per year. At even $30/hour, that’s $15,600 in labor costs for reporting alone.
An AI analytics tool that cuts reporting time by 80% saves you $12,480 per year in labor — far more than the cost of any AI analytics subscription.
Frequently Asked Questions
Will AI analytics tools import my existing Excel reports?
Most AI analytics platforms can import CSV and Excel files as data sources. However, the bigger value is connecting directly to your live data sources (Shopify, QuickBooks, etc.) rather than importing static Excel files. This eliminates the export-import cycle entirely.
Do I need to learn anything new to use AI analytics?
No. If you can type a question in English, you can use AI analytics. The whole point is that you don’t need to learn formulas, pivot tables, or any technical skills. You ask questions, and the AI gives you answers.
Is AI analytics accurate enough to trust for financial reporting?
AI analytics tools query your actual data directly — the accuracy depends on the quality of your source data, not the AI. In fact, AI is typically more accurate than Excel-based reporting because it eliminates manual formula errors. For regulatory or audit-grade reporting, always verify against source systems regardless of the tool you use.
Can I share AI analytics reports with people outside my company?
Yes. Most AI analytics platforms let you export reports as PDFs, share view-only dashboard links, or generate presentation decks. Some platforms like Pulse AI can generate slide decks automatically that you can share with investors, board members, or partners.


