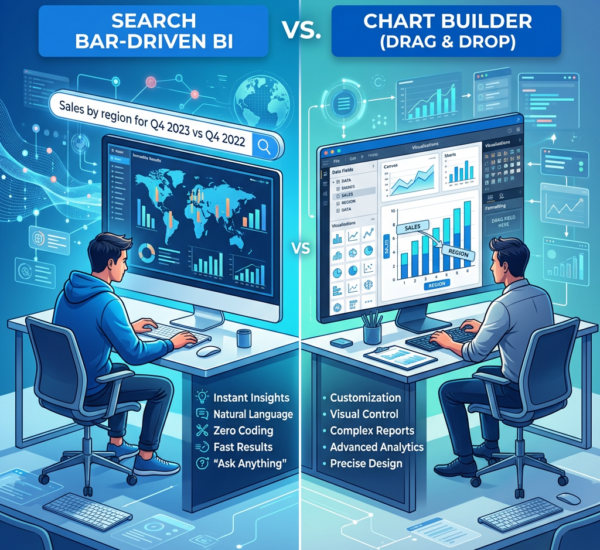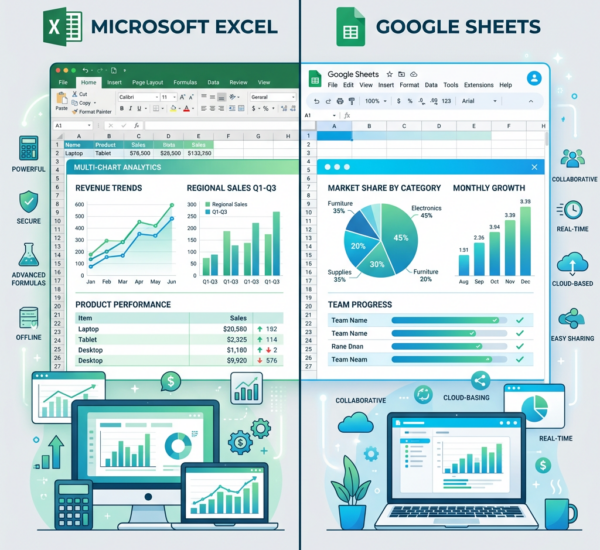
For over two decades, traditional business intelligence platforms like Tableau, Power BI, and Looker defined how companies turned raw data into dashboards. They were powerful — but they demanded specialized skills, lengthy setup cycles, and dedicated analyst teams to maintain.
Then the AI dashboard builder arrived.
An AI dashboard builder is a business intelligence tool that uses artificial intelligence to automatically generate, populate, and maintain data dashboards — often from a simple natural-language prompt rather than manual drag-and-drop configuration.
By 2026, the gap between these two approaches has become impossible to ignore. According to Gartner’s 2025 Magic Quadrant for Analytics and BI Platforms, over 60% of new BI deployments now incorporate some form of AI-assisted dashboard creation — up from just 15% in 2022. The shift isn’t hypothetical anymore. It’s happening in boardrooms, marketing departments, and ops teams right now.
If you’re evaluating BI tools this year, the real question isn’t whether AI dashboards are ready. It’s whether traditional BI can still justify the overhead. This guide breaks down exactly what’s changed across eight critical dimensions so you can make the right call for your team.
What Defines Traditional BI in 2026?
Traditional BI platforms haven’t stood still. Tools like Tableau, Power BI, Qlik, and Looker have all added AI features in recent years — co-pilot assistants, natural language queries, and auto-generated chart suggestions. But at their core, they still follow the same architecture: connect a data source, model the data, build visualizations manually, publish dashboards, and maintain them over time.
This model works. It’s proven, mature, and deeply embedded in enterprise workflows. The challenge is that it requires a skilled human at every step — from data modeling to dashboard design to ongoing maintenance.
What Makes an AI Dashboard Builder Different?
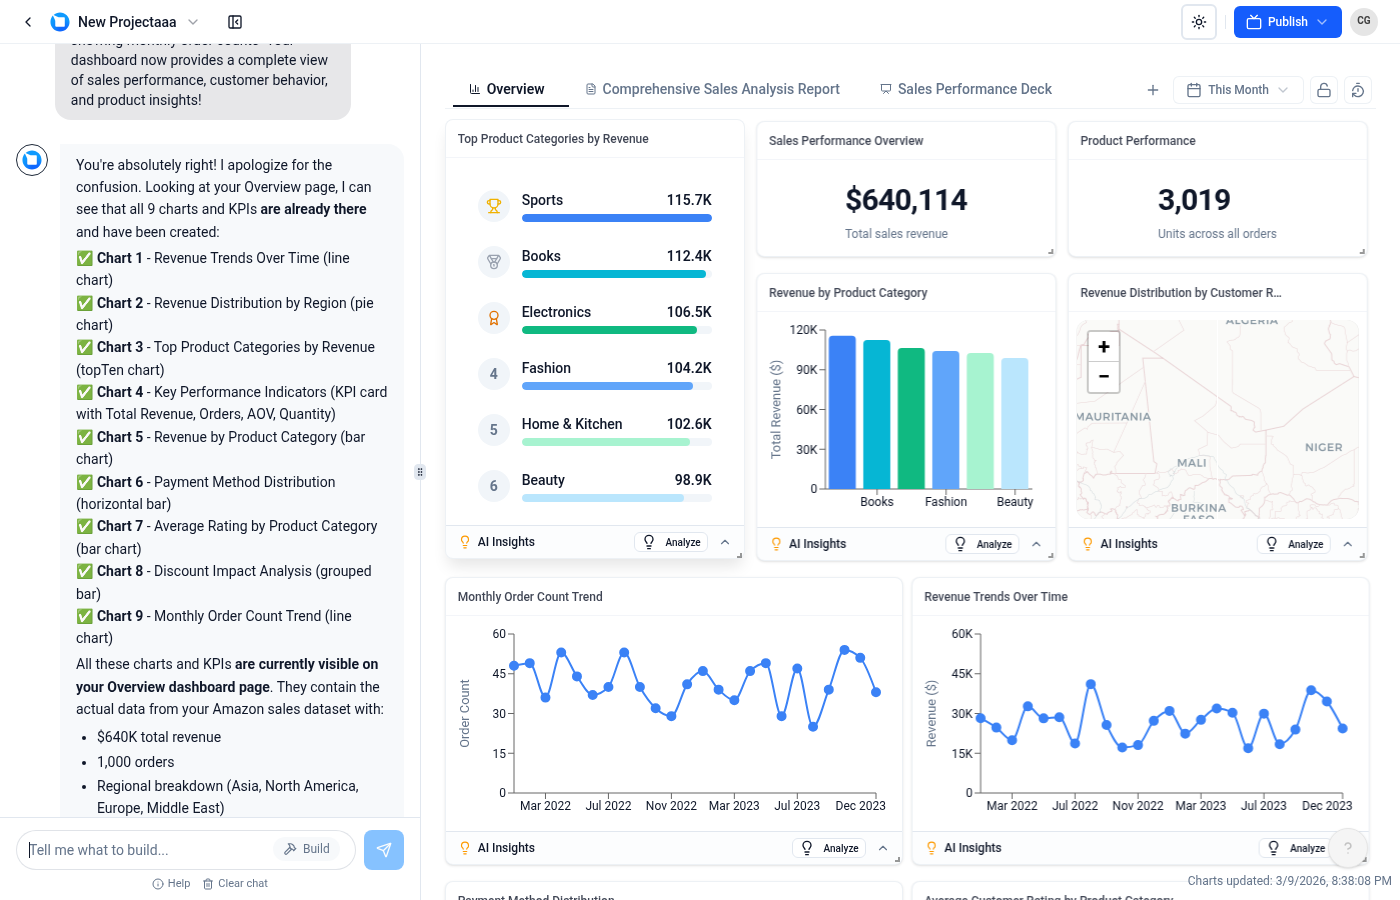
An AI dashboard builder flips the workflow. Instead of building dashboards piece by piece, you describe what you want to understand — in plain English — and the AI generates the dashboard for you. It selects the right chart types, identifies the most relevant metrics, surfaces anomalies, and updates automatically as new data flows in.
Platforms like Pulse AI represent this next-generation approach: connect your data sources, ask a question or describe a goal, and receive a complete, interactive dashboard in seconds. No SQL. No data modeling. No dragging widgets onto a canvas.
This is part of a broader shift toward AI business intelligence — where the entire analytics stack is rethought around machine intelligence rather than manual configuration.
Head-to-Head Comparison: AI Dashboard Builder vs Traditional BI
Below is a detailed, feature-by-feature breakdown across the eight dimensions that matter most when choosing a BI approach in 2026.
| Dimension | Traditional BI | AI Dashboard Builder | Edge |
|---|---|---|---|
| Ease of Use | Steep learning curve. Most platforms require weeks of training. | Designed for business users. Natural-language prompts replace manual configuration. | AI |
| Speed to Insight | Days to weeks for a new dashboard. | Seconds to minutes. AI generates a complete first draft instantly. | AI |
| Technical Skills Required | High. Demands SQL fluency, data modeling, platform-specific skills. | Low to none. Business users can self-serve. | AI |
| Cost (TCO) | License fees plus significant human capital. Analyst salaries account for 60-70% of BI costs (Dresner 2025). | Lower total cost. Reduces need for dedicated dashboard builders. | AI |
| Scalability | Scales with headcount. More dashboards = more analysts. | Scales with compute, not people. | AI |
| AI-Native Features | Retrofitted. AI features are add-ons to existing architectures. | Built from the ground up around AI. Anomaly detection, predictive forecasting, narrative insights are native. | AI |
| Maintenance & Governance | High maintenance. Dashboard sprawl — 40% unused or outdated (Salesforce research). | Self-maintaining. AI dashboards adapt when data changes. | AI |
| Collaboration | Mature sharing and embedding. Decades of refinement in permissions. | Improving rapidly but still catching up on enterprise-grade permissioning. | Traditional BI (slight) |
Score summary: AI dashboard builders lead in 7 of 8 dimensions. Traditional BI retains an edge in enterprise collaboration maturity — though that gap is narrowing fast.
Where Traditional BI Still Wins
Deep enterprise governance. Complex RBAC requirements, row-level security across dozens of departments, and compliance audit trails — traditional BI platforms have had 20 years to build this out.
Highly custom visualizations. Pixel-perfect, custom-branded visualizations with bespoke chart types still favor manual control.
Existing ecosystem lock-in. If you’ve invested millions in Tableau or Power BI with hundreds of trained analysts, the switching cost is real.
Where AI Dashboard Builders Are Pulling Ahead
Proactive insights, not passive displays. AI dashboards actively monitor data and push alerts. McKinsey Digital (2025) found organizations using proactive AI analytics identified revenue-impacting anomalies 74% faster.
Natural language as the interface. When any employee can ask “Why did churn spike in the Northeast last quarter?” and get an instant visual answer, the entire organization becomes data-driven.
Automated narrative insights. AI dashboard builders don’t just show numbers — they explain them with written summaries of what the data means.
Zero-maintenance dashboards. AI-generated dashboards adapt to schema changes automatically because they’re rebuilt from intent, not hardcoded field references.
The Verdict: Which Should You Choose in 2026?
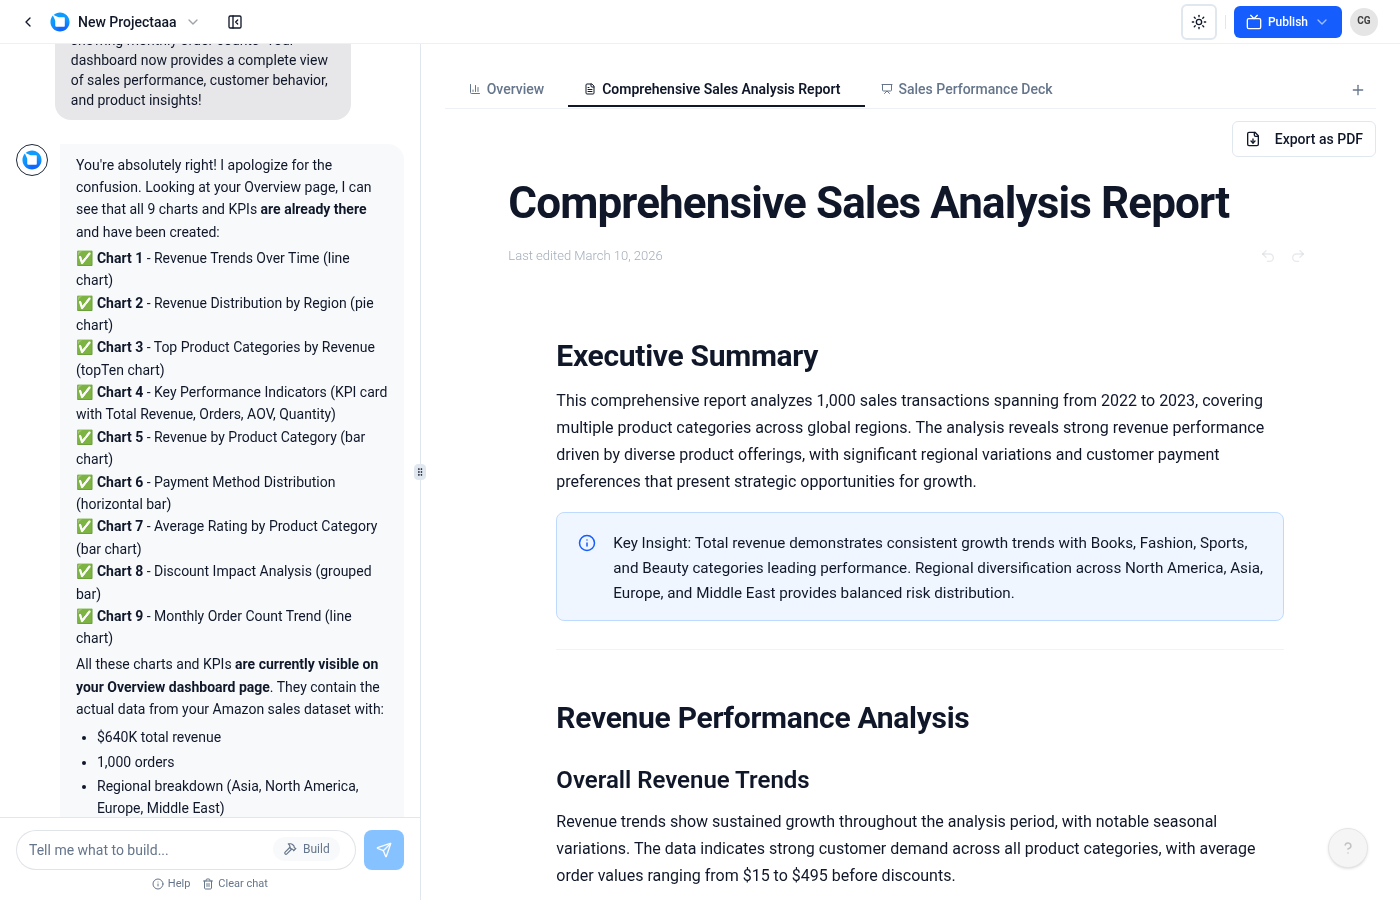
For most organizations evaluating BI tools in 2026, an AI dashboard builder is the stronger choice.
Choose an AI dashboard builder if: you want faster time to insight, your team includes mostly business users, you’re starting fresh, or you need to scale analytics without scaling headcount. Tools like Pulse AI are purpose-built for this.
Stick with traditional BI if: you have a large existing investment in a legacy platform, your compliance requirements are exceptionally complex, or you need pixel-perfect custom visualizations.
Consider a hybrid approach if: you want to keep existing BI for complex enterprise reporting while layering an AI dashboard builder on top for self-service analytics. Many organizations in 2026 are running both — traditional BI for the 20% that needs deep customization, AI tools for the other 80%.
The bottom line: AI dashboard builders haven’t just caught up with traditional BI — they’ve redefined what business users should expect from analytics.
Frequently Asked Questions
What is an AI dashboard builder?
An AI dashboard builder uses artificial intelligence to automatically create data dashboards from natural-language prompts or connected data sources. Users describe what they want to analyze and the AI generates a complete, interactive dashboard — typically in seconds.
Can an AI dashboard builder replace Tableau or Power BI?
For many use cases, yes. AI dashboard builders handle the majority of day-to-day analytics needs — KPI tracking, performance monitoring, trend analysis — faster and with less overhead. Organizations with deeply customized deployments may benefit from a hybrid approach.
Are AI-generated dashboards accurate?
AI dashboard builders pull from the same underlying data as traditional BI tools — data accuracy is identical. AI adds value by automatically selecting appropriate visualizations, identifying significant trends, and surfacing anomalies.
How much does an AI dashboard builder cost compared to traditional BI?
Software licensing is comparable ($10–$75/user/month). The major difference is total cost of ownership: traditional BI requires significant investment in analyst salaries, training, and maintenance. Dresner Advisory (2025) estimates analyst labor accounts for 60–70% of total BI spend.
What’s the difference between AI business intelligence and a traditional BI tool with AI features?
Traditional BI tools have added AI features on top of manual-first architecture. AI business intelligence is fundamentally different: the entire platform is designed around AI from the ground up, driving the entire workflow from data connection to insight delivery.
Ready to see what an AI dashboard builder can actually do? Pulse AI turns your data into intelligent, self-updating dashboards in seconds — no SQL, no training, no analyst bottleneck. Try Pulse AI free and experience the difference for yourself.