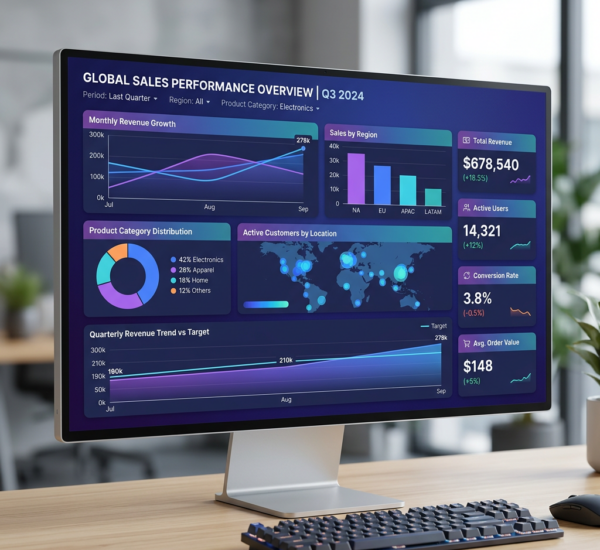
Business intelligence has always been about turning raw data into decisions. But traditional BI tools required SQL expertise, weeks of dashboard building, and a dedicated analyst team just to answer basic questions like “Why did revenue drop last quarter?”
AI business intelligence changes that equation entirely. Instead of writing queries, you ask questions in plain English. Instead of waiting days for a custom report, you get answers in seconds. And instead of dashboards that show you what happened, AI-powered BI tells you why it happened and what to do next.
This guide covers everything you need to know about AI business intelligence in 2026 — what it is, how it works, why it matters, and how to evaluate the right tool for your team.
What Is AI Business Intelligence?
AI business intelligence refers to analytics platforms that use artificial intelligence — particularly natural language processing (NLP), machine learning (ML), and large language models (LLMs) — to help users explore, analyze, and act on their business data without writing code or SQL.
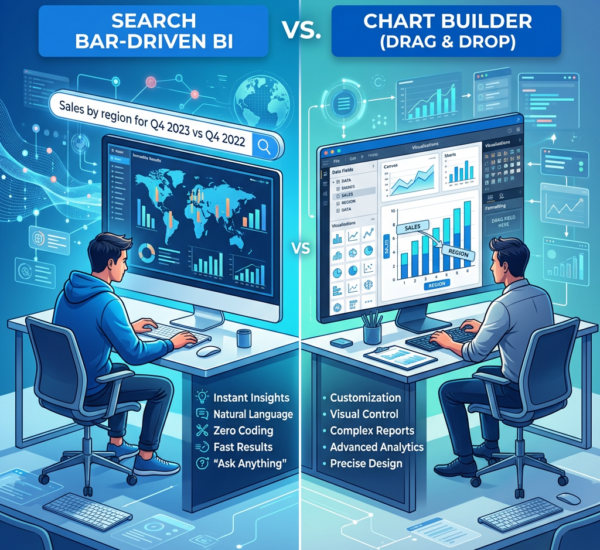
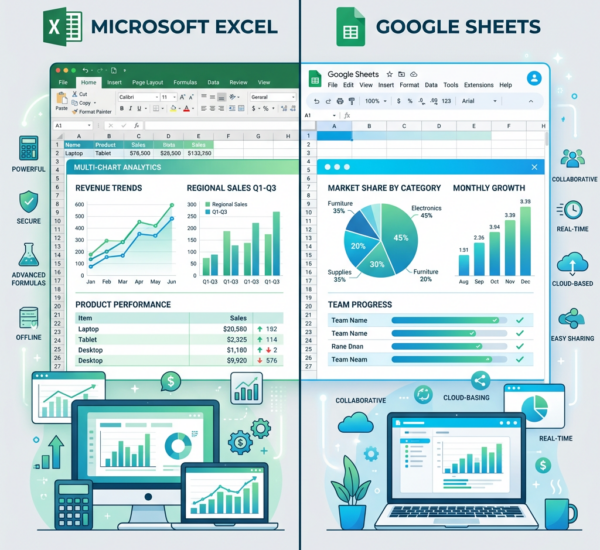
Where traditional BI tools like Tableau or Power BI require users to build dashboards manually and understand data schemas, AI BI tools let anyone in an organization ask questions in natural language and receive instant, visual answers. Think of it as the difference between searching a library catalog manually versus asking a librarian who’s read every book.
Key Capabilities of AI Business Intelligence
Natural language querying: Users type questions like “What were our top 5 products by revenue last month?” and get instant charts, tables, and summaries — no SQL required.
Automated insight generation: AI proactively surfaces anomalies, trends, and correlations in your data. Instead of hunting for insights manually, the system alerts you when something significant changes.
Predictive analytics: Machine learning models forecast future trends based on historical patterns — revenue projections, churn predictions, demand forecasting — without requiring data science expertise.
Smart dashboards: AI-powered dashboards adapt to the user’s role and behavior. A CMO sees marketing metrics; a sales lead sees pipeline data. The AI prioritizes what’s relevant.
Data storytelling: Rather than presenting raw numbers, AI BI tools generate written narratives that explain what the data means in business context.
How AI Business Intelligence Works
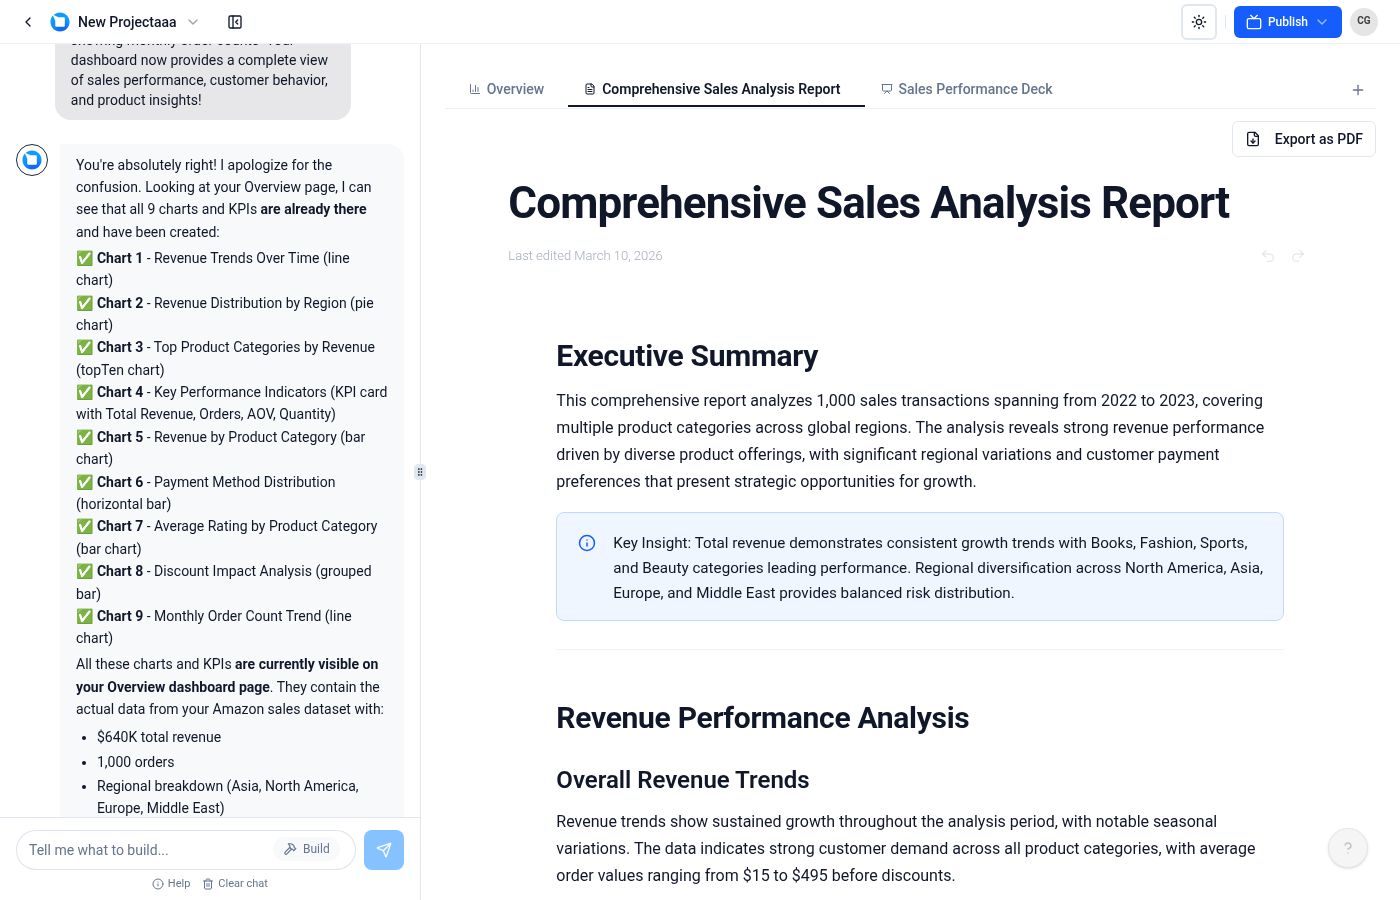
Under the hood, AI BI platforms combine several technologies to bridge the gap between your data and your decisions.
Step 1: Data Connection and Preparation
AI BI tools connect to your existing data sources — databases (PostgreSQL, MySQL, BigQuery), SaaS platforms (Salesforce, HubSpot, Stripe, Google Analytics), spreadsheets, and APIs. The AI maps your data schema, understands table relationships, and creates a semantic layer that translates technical column names into business terms.
Step 2: Natural Language Understanding
When you ask a question, the NLP engine parses your query, identifies intent, maps business terms to database fields, and generates the appropriate SQL or API calls behind the scenes. Modern platforms use LLMs to handle ambiguous or complex questions that older keyword-matching systems couldn’t understand.

Step 3: Query Execution and Visualization
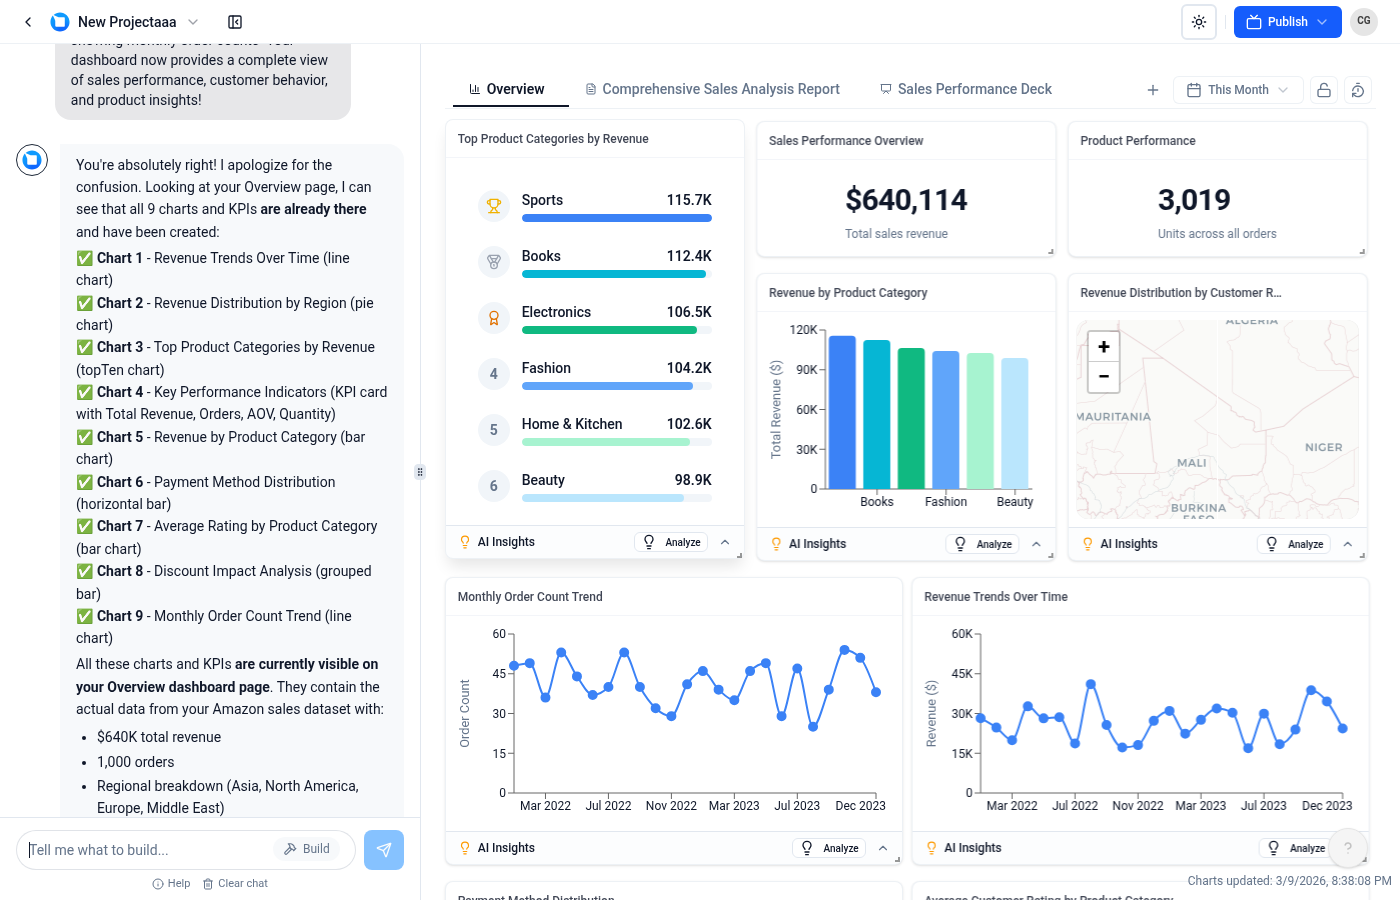
The generated query runs against your live data. The AI then selects the most appropriate visualization — bar chart, line graph, pivot table, or KPI card — based on the data type and question context. No manual chart configuration needed.
Step 4: Insight Layer
Beyond answering your specific question, AI BI tools analyze the results for additional context. They might flag that “revenue is up 12% but customer acquisition cost also increased 23%” or highlight a geographic segment that’s outperforming others.
AI Business Intelligence vs. Traditional BI: What’s Different?
The shift from traditional to AI-powered BI isn’t just an incremental improvement — it fundamentally changes who can use analytics and how fast they get answers.
Accessibility: Traditional BI requires technical skills (SQL, data modeling). AI BI is designed for business users who think in questions, not queries. Anyone who can type a question can analyze data.
Speed to insight: Building a traditional dashboard takes days to weeks. AI BI delivers answers in seconds. When your CEO asks “How are we trending vs. last quarter?” in a Monday meeting, you don’t need to say “I’ll have a report by Friday.”
Proactive vs. reactive: Traditional BI shows you what you ask to see. AI BI proactively alerts you to anomalies and opportunities you didn’t know to look for.
Maintenance burden: Traditional dashboards break when data schemas change. AI BI adapts because it understands the semantic meaning of your data, not just the technical structure.
Scalability of knowledge: With traditional BI, only a few analysts can create reports. With AI BI, every team member becomes self-sufficient in data analysis, reducing the analytics bottleneck.
Who Benefits from AI Business Intelligence?
Startup founders and CEOs who need real-time visibility into metrics but don’t have a data team. AI BI lets them connect their tools and immediately start asking questions about revenue, growth, and operations.
Marketing teams tracking campaign performance across multiple channels. Instead of logging into Google Analytics, Facebook Ads, and HubSpot separately, ask one platform: “Which channel had the lowest CAC last month?”
Sales leaders who want pipeline forecasts and deal analysis without waiting for a RevOps team to build reports. Natural language queries make CRM data accessible to everyone.
Operations teams monitoring supply chain, logistics, or production data. AI surfaces bottlenecks and anomalies faster than manual dashboard monitoring.
Finance teams running scenario analysis, budget tracking, and revenue forecasting. AI models can predict cash flow and flag spending anomalies automatically.
How to Evaluate AI Business Intelligence Tools
Not all AI BI platforms are created equal. Here’s what to look for when evaluating solutions for your team.
Data Source Connectivity
How many integrations does the platform offer? Can it connect to your specific database, CRM, and SaaS tools? Look for native connectors rather than requiring manual CSV uploads. The best platforms connect to your data in minutes, not days.
Quality of Natural Language Understanding
Ask complex questions during your evaluation. Can the tool handle follow-up questions? Does it understand business context? A good AI BI tool should handle “Show me revenue by region, but exclude the APAC pilot program” without breaking.
Accuracy and Transparency
Can you see the SQL or query the AI generated? Trustworthy AI BI tools show their work so you can verify answers. Look for platforms that explain their methodology, not just black-box results.
Collaboration Features
Can you share insights with teammates, schedule automated reports, or embed dashboards? BI is a team sport — the tool should support collaboration natively.
Security and Compliance
Your business data is sensitive. Evaluate the platform’s data encryption, access controls, SOC 2 compliance, and data residency options. Ensure the AI doesn’t train on your proprietary data.
Pricing Model
Some platforms charge per user, others per query, and some offer flat-rate pricing. Consider your team size and usage patterns. Per-query pricing can get expensive fast for data-heavy teams.
The Future of AI Business Intelligence
We’re still in the early innings of AI-powered analytics. Here’s where the field is heading.
Conversational analytics: Rather than one-off questions, you’ll have multi-turn conversations with your data — drilling down, pivoting, and exploring like you would with a human analyst.
Autonomous insights: AI will shift from answering questions to proactively running analyses and delivering recommendations. Imagine your BI tool sending you a morning briefing: “Revenue is trending 8% above forecast. Here are the three factors driving it.”
Embedded AI analytics: AI BI will be embedded directly into the tools you already use — your CRM, project management platform, or communication tools — rather than living in a separate analytics application.
Multi-modal analysis: Future AI BI tools will analyze not just structured data but also documents, images, and even video — giving businesses a truly comprehensive intelligence layer.
Getting Started with AI Business Intelligence
The best way to understand AI business intelligence is to try it. Most modern platforms offer free trials that let you connect your data and start asking questions immediately.
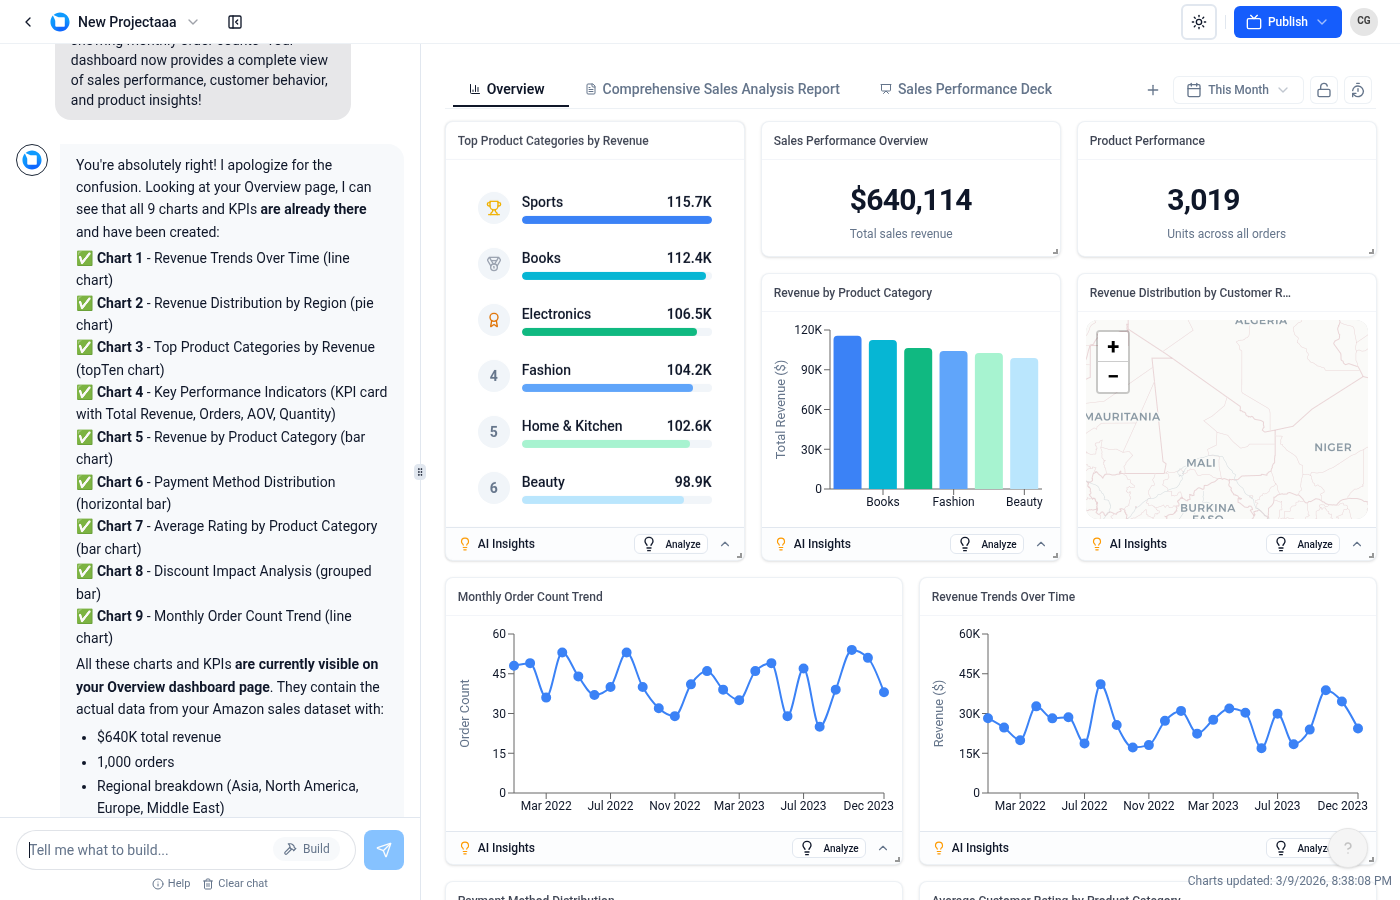
Pulse AI is built for teams that want to chat with their business data using natural language — connect your databases and SaaS tools, ask questions, and get instant visual answers. No SQL or technical skills required.
Whether you’re a startup founder tracking growth metrics or an enterprise team replacing legacy BI tools, AI business intelligence represents the biggest shift in how organizations make data-driven decisions since the spreadsheet.
The question isn’t whether your team will adopt AI-powered analytics — it’s whether you’ll do it before your competitors do.
Frequently Asked Questions
What is the difference between AI BI and traditional BI?
Traditional BI tools require technical expertise to build dashboards and write SQL queries. AI business intelligence lets anyone ask questions in natural language and get instant answers. AI BI is also proactive — it surfaces insights automatically rather than waiting for someone to build the right report.
Is AI business intelligence accurate?
Modern AI BI platforms are highly accurate because they generate precise database queries (SQL) from your natural language questions. The best tools show the underlying query so you can verify results. Accuracy depends on data quality — clean, well-structured data produces the most reliable insights.
Do I need a data team to use AI business intelligence?
No — that’s the primary advantage. AI BI tools are designed for business users without technical backgrounds. You can connect your data sources and start asking questions immediately. That said, having a data team helps with data governance, quality, and more advanced analytical needs.
How much does AI business intelligence cost?
Pricing varies widely. Some platforms offer free tiers for small teams, while enterprise solutions can cost thousands per month. Most tools offer per-user or flat-rate pricing. Evaluate based on your team size and expected usage volume.
Can AI business intelligence replace my existing dashboards?
AI BI can complement or replace traditional dashboards depending on your needs. Many teams use AI BI for ad-hoc questions and exploration while maintaining key dashboards for standardized reporting. Over time, the AI-driven approach often reduces the number of static dashboards needed.