Google Analytics collects massive amounts of traffic data, but most teams struggle to turn that data into decisions. Opening GA4, filtering reports, exporting CSVs, and building charts in spreadsheets wastes hours every week.
The solution: Connect Google Analytics to a dashboard that actually makes sense. See your traffic, conversions, and user behavior in clean, actionable visualizations. Share insights with your team. No more digging through GA4’s confusing interface.
Pulse AI makes this simple. Connect Google Analytics in 3 clicks. Choose the metrics you care about. Build a dashboard in minutes, not hours. No SQL. No coding. No technical complexity.
This guide shows you how to connect Google Analytics to a dashboard, which metrics to track, and why Pulse AI is the fastest way to turn GA data into insights.
Why Connect Google Analytics to a Dashboard?
Google Analytics collects great data, but its interface is:
Overwhelming. Hundreds of reports, filters, and metrics. Most teams only need 10-15 KPIs but spend 20 minutes finding them.
Not customizable. Can’t combine GA data with other sources (CRM, ad platforms, sales data) in one view.
Hard to share. Sending screenshots or exporting CSVs to stakeholders is clunky. Everyone needs GA access and training.
Slow to update. GA4 data lags 24-48 hours. Dashboards update faster.
A dashboard fixes all of this. You choose the metrics that matter, visualize them clearly, and share them with anyone — no GA training required.
Key Google Analytics Metrics to Track in Your Dashboard
You don’t need to track everything Google Analytics collects. Focus on metrics that drive decisions.
Traffic Metrics
Users: Total unique visitors to your site. Shows traffic trends over time.
Sessions: Total visits (including repeat visits from the same user). Shows engagement.
Pageviews: Total pages viewed. High pageviews per session = good engagement.
New vs. Returning Users: Are you attracting new visitors or relying on returning traffic?
Traffic by Source/Medium: Where visitors come from (organic search, paid ads, social, email, direct, referral).
Traffic by Device: Desktop vs. mobile vs. tablet. Shows if mobile experience needs work.
Engagement Metrics
Bounce Rate: Percentage of visitors who leave after viewing one page. High bounce rate = poor landing pages or targeting.
Average Session Duration: How long visitors stay. Longer = better engagement.
Pages per Session: How many pages visitors view per visit. Higher = better engagement.
Top Landing Pages: Which pages bring in the most traffic? Optimize these first.
Top Exit Pages: Where do visitors leave? Fix these pages to reduce drop-off.
Conversion Metrics
Goal Completions: Tracked actions like form submissions, purchases, sign-ups, or downloads.
Goal Conversion Rate: Percentage of sessions that complete a goal.
E-commerce Revenue: Total revenue from tracked transactions (if you have e-commerce tracking enabled).
E-commerce Conversion Rate: Percentage of sessions that result in a purchase.
Revenue by Traffic Source: Which channels drive sales, not just traffic?
Audience Metrics
Demographics: Age and gender of your audience (if enabled).
Geo: Where your visitors are located (country, region, city).
Interests: What your audience cares about (based on Google’s affinity categories).
Behavior (New vs. Returning): Are new visitors converting better than returning ones?
Most teams only need 10-15 of these metrics in a dashboard. Pulse AI lets you pick exactly what you need.
How to Connect Google Analytics to Pulse AI (Step-by-Step)
Connecting Google Analytics to Pulse AI takes 3 clicks. No coding. No API keys. No technical setup.
Step 1: Log into Pulse AI
Go to usepulseai.com and sign in.
Step 2: Add Google Analytics as a Data Source
Click “Add Data Source” → Select “Google Analytics” → Authenticate with your Google account.
Pulse AI uses OAuth, so you just click “Allow” and it connects instantly. No API keys to copy-paste.
Step 3: Choose Your Google Analytics Property
If you have multiple GA properties (multiple websites or apps), select the one you want to connect.
Step 4: Select Metrics
Choose which metrics you want to track. Pulse AI suggests the most common ones (users, sessions, bounce rate, conversions, revenue), but you can add or remove any metric.
Step 5: Build Your Dashboard
Drag and drop visualizations onto your dashboard:
- Line charts for traffic trends
- Bar charts for traffic sources
- Tables for top pages
- Pie charts for device breakdown
Customize colors, labels, and time ranges.
Step 6: Share
Send a link to your team, embed in Slack, or schedule automated email reports.
Total time: 5-10 minutes.
Use Cases: What You Can Do with a Google Analytics Dashboard
Use Case 1: Track Website Traffic Performance
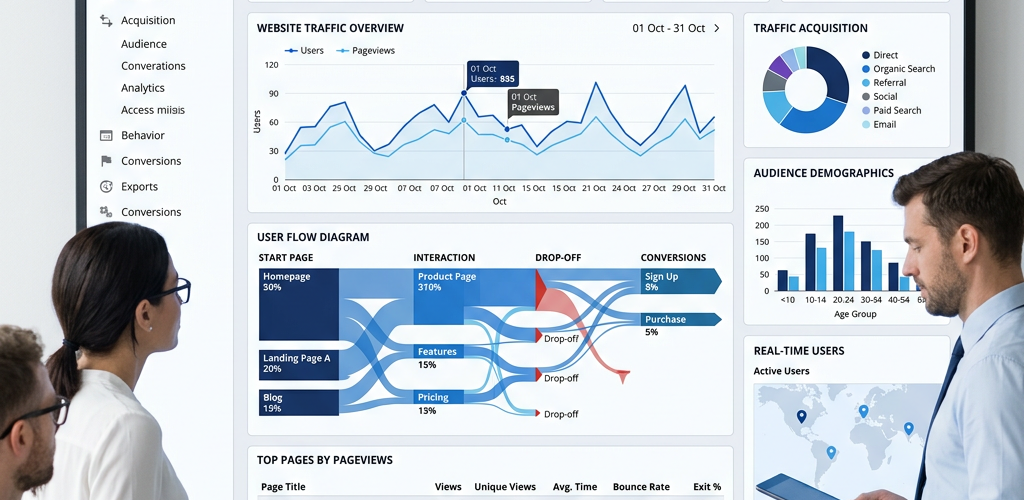
See how many visitors your site gets, where they come from, and how they behave — all in one dashboard.
Metrics to track:
- Total users (this week, this month, this quarter)
- Traffic by source (organic, paid, social, email, direct, referral)
- Top landing pages
- Bounce rate
- Average session duration
Why it works: Instantly see if traffic is growing or declining. Identify which channels drive the most visitors. Spot pages with high bounce rates and fix them.
Use Case 2: Monitor Marketing Campaign Performance
Track how your marketing campaigns (Google Ads, Facebook Ads, email campaigns) drive traffic and conversions.
Metrics to track:
- Sessions by campaign
- Conversions by campaign
- Conversion rate by campaign
- Revenue by campaign (if e-commerce tracking is enabled)
- Cost per acquisition (if you connect ad platforms too)
Why it works: See which campaigns are working and which aren’t. If Campaign A drives 1,000 sessions but zero conversions while Campaign B drives 100 sessions and 20 conversions, shift budget to Campaign B.
Use Case 3: Analyze Content Performance
Which blog posts, landing pages, or product pages drive the most traffic and conversions?
Metrics to track:
- Top pages by pageviews
- Top pages by users
- Top pages by conversions
- Bounce rate by page
- Average time on page
Why it works: Double down on high-performing content. If “How to Build a Dashboard” gets 10x more traffic than other blog posts, write more content like it.
Use Case 4: Understand Audience Behavior
Who is visiting your site? Where are they from? What devices do they use?
Metrics to track:
- Users by country/region
- Users by device (mobile vs. desktop)
- New vs. returning users
- Demographics (age, gender)
- Top referral sources
Why it works: Tailor your site and marketing to your actual audience. If 70% of traffic is mobile but your site isn’t mobile-optimized, you’re losing conversions.
Use Case 5: Track E-commerce Performance
For online stores, combine Google Analytics with your e-commerce platform (Shopify, WooCommerce) to see traffic AND revenue.
Metrics to track:
- Total revenue
- E-commerce conversion rate
- Revenue by traffic source
- Revenue by product
- Average order value
Why it works: See which traffic sources drive sales, not just visitors. Organic search might drive 50% of traffic but only 10% of revenue while email drives 10% of traffic and 40% of revenue.
Google Analytics Dashboards: Pulse AI vs. Other Tools
| Feature | Pulse AI | Google Looker Studio | Tableau | Power BI | Custom Build (Sheets/Code) | |———|———-|———————|———|———-|—————————| | Setup time | 5-10 minutes | 1-2 hours | Days | Days | Weeks | | Requires technical skills | No | Some | Yes | Yes | Yes | | Combines GA with other data | ✅ Yes (CRM, ads, etc.) | ✅ Yes | ✅ Yes | ✅ Yes | ⚠️ Manual | | Real-time updates | ✅ Yes | ⚠️ Limited | ✅ Yes | ✅ Yes | ❌ Manual refresh | | Pre-built templates | ✅ Yes | ⚠️ Some | ❌ No | ❌ No | ❌ No | | Pricing | From $29/month | Free (Google account required) | From $70/user/month | From $10/user/month | Free (but high time cost) | | Best for | Teams who want results fast | Budget-conscious teams with time | Data teams | Microsoft-heavy orgs | Developers |
Google Looker Studio (formerly Data Studio) is free and connects to GA easily, but it’s limited. Customization is clunky, and it doesn’t handle multiple data sources well.
Tableau and Power BI are powerful but require technical expertise and take days to set up.
Building a custom dashboard (with Google Sheets + Apps Script or code) is flexible but time-consuming and requires ongoing maintenance.
Pulse AI gives you the power of Tableau with the simplicity of Looker Studio. You get results in minutes, not days.
Common Mistakes When Building Google Analytics Dashboards
Mistake 1: Tracking too many metrics
Dashboards with 50 metrics overwhelm users. Focus on 10-15 KPIs that drive decisions.
Mistake 2: Not filtering out internal traffic
If you don’t exclude your team’s traffic, your metrics are inflated. Set up GA filters to exclude internal IPs.
Mistake 3: Ignoring mobile vs. desktop breakdowns
If 60% of traffic is mobile but you only optimize for desktop, you’re losing conversions. Always segment by device.
Mistake 4: Focusing on vanity metrics
Pageviews and sessions are interesting but don’t drive business decisions. Focus on conversion rate, revenue, and traffic sources instead.
Mistake 5: Not connecting GA to other data sources
GA shows traffic and conversions, but it doesn’t show ad spend, CRM data, or sales closed. Connect GA to ad platforms and CRM for complete attribution.
Pulse AI helps you avoid these mistakes with smart defaults and suggested metrics.
Advanced: Combine Google Analytics with Other Data Sources
Google Analytics is powerful, but combining it with other data sources unlocks deeper insights.
GA + Google Ads / Facebook Ads
See traffic AND ad spend in one dashboard. Calculate ROI, cost per conversion, and ROAS.
Example: Google Ads drove 1,000 sessions and 50 conversions. You spent $500. Cost per conversion = $10. If average order value is $100, ROAS = 10x.
GA + CRM (Salesforce, HubSpot)
Track the full customer journey from website visit to closed deal.
Example: 10,000 website sessions → 500 leads → 50 opportunities → 10 closed deals. You can see conversion rates at each stage and optimize weak points.
GA + E-commerce Platform (Shopify, WooCommerce)
Combine traffic data with product performance. See which traffic sources drive revenue, not just visits.
Example: Organic search drives 40% of traffic and 60% of revenue. Paid social drives 30% of traffic and 10% of revenue. Double down on organic SEO.
GA + Email Platform (Mailchimp, Klaviyo)
Track email click-throughs and revenue attribution.
Example: Email campaign drives 500 sessions and $5,000 revenue. Cost per email = $0.10. Revenue per email = $10. Clear ROI.
Pulse AI connects all of these in one dashboard. No manual data merging.
Pulse AI connects Google Analytics (and all your other tools) automatically. Track traffic, conversions, and revenue in real-time. Try Pulse AI free.
Frequently Asked Questions
How do you connect Google Analytics to a dashboard?
Use a BI tool like Pulse AI that has a pre-built Google Analytics connector. Log in, authenticate with Google, select your GA property, choose metrics, and build visualizations. With Pulse AI, this takes 5-10 minutes.
Can you build a Google Analytics dashboard for free?
Yes. Google Looker Studio (formerly Data Studio) is free and connects to Google Analytics. But it’s limited compared to paid BI tools. Pulse AI offers more flexibility, better design, and multi-source integration.
What metrics should a Google Analytics dashboard include?
Focus on traffic (users, sessions, traffic sources), engagement (bounce rate, session duration, pages per session), and conversions (goal completions, conversion rate, revenue). Don’t track everything — choose 10-15 KPIs that drive decisions.
How often should a Google Analytics dashboard update?
Real-time if possible, but GA4 data typically lags 24-48 hours. Set your dashboard to refresh daily or hourly. Pulse AI updates as soon as new GA data is available.
Can you combine Google Analytics with other data sources in one dashboard?
Yes. Pulse AI lets you combine Google Analytics with CRM (Salesforce, HubSpot), ad platforms (Google Ads, Facebook Ads), e-commerce (Shopify, WooCommerce), and email platforms (Mailchimp, Klaviyo) in one dashboard.
What’s better: Google Looker Studio or Pulse AI for Google Analytics dashboards?
Google Looker Studio is free and works well for simple dashboards with only GA data. Pulse AI is better if you need to combine GA with other data sources, want faster setup, or prefer cleaner design. Pulse AI also offers better support and templates.
Do you need coding skills to connect Google Analytics to a dashboard?
No. Tools like Pulse AI and Google Looker Studio use OAuth authentication (just click “Allow”). No API keys, no coding, no technical setup required.
Can you track Google Ads and Facebook Ads performance in a Google Analytics dashboard?
Yes, if you’ve set up UTM parameters on your ad campaigns. Google Analytics tracks traffic from ads, and Pulse AI can combine that with ad spend data from Google Ads and Facebook Ads to calculate ROI and ROAS.
Conclusion: Turn Google Analytics Data into Decisions with Pulse AI
Google Analytics collects powerful data, but its interface makes insights hard to find. Building a custom dashboard turns GA data into clear, actionable visualizations your whole team can understand.
Most dashboard tools are slow to set up, require technical skills, or cost a fortune.
Pulse AI is different. Connect Google Analytics in 3 clicks. Choose the metrics that matter. Build a dashboard in minutes. Share with your team instantly. No coding. No complexity.
Stop wasting time digging through Google Analytics reports. Start making better data-driven decisions.