Every business owner knows they should be “data-driven,” but most don’t know which data actually matters. Tracking everything leads to dashboard overload. Tracking nothing means flying blind. Here’s exactly what to track at each stage of business growth — from startup to scale.
Essential Business Metrics Every Small Business Should Track
Before diving into stage-specific metrics, every business needs these five foundational numbers:
Revenue — total income, broken down by product/service, channel, and time period. This is your north star metric. Track it daily.
Profit margin — revenue minus all costs, expressed as a percentage. Revenue growth means nothing if margins are shrinking. Track monthly.
Cash flow — money in vs money out on a rolling basis. Profitable businesses go bankrupt from cash flow problems more often than from unprofitability. Track weekly.
Customer acquisition cost (CAC) — total marketing and sales spend divided by new customers acquired. If it costs you $200 to acquire a customer who spends $150, you have a problem. Track monthly.
Customer retention rate — what percentage of customers come back or stay subscribed. It costs 5–7x more to acquire a new customer than to retain an existing one. Track monthly.
KPIs for Small Business Growth by Stage
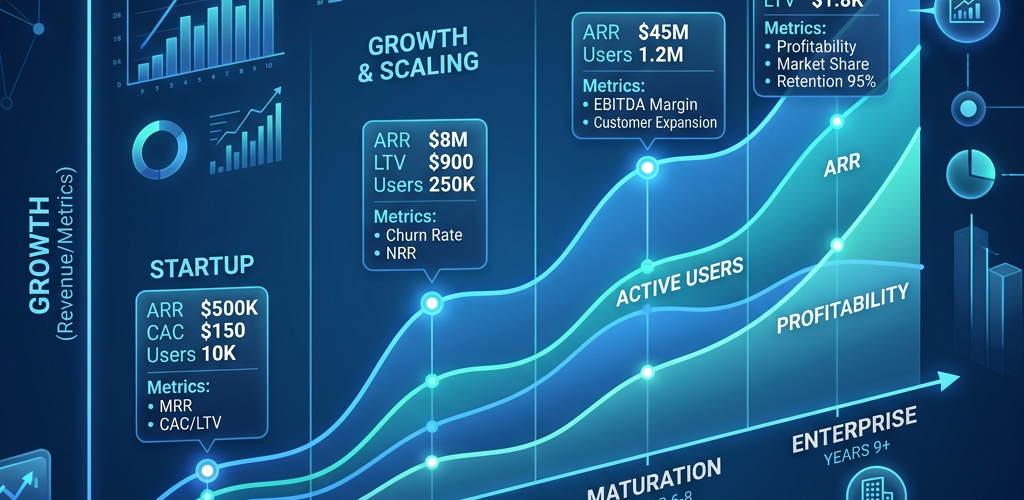
Startup stage (0–$100K revenue): At this stage, focus on validation metrics. Are people buying? Are they coming back? Can you acquire customers profitably?
→ Core metrics: Revenue, number of customers, conversion rate (visitors to buyers), customer feedback/NPS, burn rate (how fast you’re spending cash).
→ Don’t track yet: Detailed cohort analysis, multi-touch attribution, advanced segmentation. You don’t have enough data for these to be meaningful.
Growth stage ($100K–$1M revenue): You’ve proven product-market fit. Now focus on efficiency and scaling.
→ Core metrics: Everything from startup, plus: customer acquisition cost by channel, customer lifetime value (LTV), LTV:CAC ratio (should be 3:1 or higher), churn rate, average order value, revenue by channel/product.
→ Key insight: At this stage, the LTV:CAC ratio is your most important metric. It tells you if your growth is sustainable. If you’re spending $100 to acquire a customer worth $50 lifetime, scaling faster just means losing money faster.
Scale stage ($1M+ revenue): You’re optimizing a proven model. Focus on unit economics and operational efficiency.
→ Core metrics: Everything from growth, plus: contribution margin by product/segment, cohort retention curves, marketing channel efficiency (ROAS by channel), operational efficiency metrics (support tickets per customer, fulfillment cost per order), net revenue retention.
→ Key insight: At this stage, segmentation matters more than top-line numbers. Your average customer LTV might look healthy, but if your best segment has $500 LTV and your worst has $50, you need to know that to allocate resources effectively.
What Data Should I Track by Department?
Sales: Pipeline value, win rate, average deal size, sales cycle length, leads by source, conversion rate by stage, revenue per sales rep. The most important question: “Are we going to hit our target this month?” If your dashboard can answer that accurately, your sales tracking is solid.
Marketing: Traffic by source, conversion rate by channel, customer acquisition cost by channel, marketing qualified leads (MQLs), return on ad spend (ROAS), content performance, email open/click rates. The most important question: “Which channel should we invest more in?”
Finance: Cash position, accounts receivable aging, accounts payable, gross margin, operating expenses as % of revenue, burn rate, runway. The most important question: “Do we have enough cash for the next 6 months?”
Operations: Order fulfillment time, error rate, inventory turnover, supplier lead times, customer support ticket volume and resolution time. The most important question: “Where are the bottlenecks?”
Customer success: NPS score, churn rate, expansion revenue, support ticket volume, time to value (how quickly new customers get their first success), customer health score. The most important question: “Which customers are at risk of leaving?”
What Insights Can I Get From My Business Data With AI?
Raw metrics are useful, but AI-powered analytics goes beyond displaying numbers to surface insights you wouldn’t find on your own:
Anomaly detection: “Your conversion rate dropped 23% yesterday compared to the same day last week. This correlates with a 40% increase in page load time.” You didn’t have to look for this — the AI found it and told you.
Predictive forecasting: “Based on current trends and seasonality, projected revenue for next month is $47,000–$52,000, which is 15% above target.” Now you can plan inventory, staffing, and cash flow around an actual forecast instead of a gut feeling.
Root cause analysis: “Customer churn increased 8% this quarter. The primary driver is customers acquired through Facebook Ads in Q2 — they have 40% lower retention than organic customers.” Now you know where to focus your retention efforts.
Opportunity identification: “Customers who buy Product A and Product B together have 3x higher lifetime value. Only 12% of Product A buyers also buy Product B.” Now you know to create a bundle or cross-sell campaign.
Tools like Pulse AI generate these insights automatically by continuously analyzing your data across all connected sources. Instead of building dashboards and hoping you notice the important patterns, the AI tells you what matters.
How to Start Tracking Business Data (If You’re Starting From Zero)
If you’re currently tracking nothing — or everything is in scattered spreadsheets — here’s your 30-minute quickstart:
Minute 1–5: Sign up for an AI analytics tool like Pulse AI.
Minute 5–15: Connect your core data sources: your e-commerce platform or invoicing tool (revenue data), your marketing tools (Google Analytics, ad platforms), and your financial tool (QuickBooks, Xero, or bank connection).
Minute 15–25: Review the auto-generated dashboard. The AI will show you your key metrics based on the data available. Ask a few questions: “What was my revenue last month?” “Which product is growing fastest?” “What’s my customer acquisition cost?”
Minute 25–30: Set up alerts for the metrics that matter most. “Notify me if daily revenue drops more than 20% below average” or “Alert me if customer churn exceeds 5% in a month.”
That’s it. You’ve gone from zero tracking to AI-powered analytics in 30 minutes. You can refine over time, but you’ll have more insight into your business after 30 minutes of setup than most businesses get from months of manual spreadsheet tracking.
Frequently Asked Questions
What’s the single most important metric for a small business to track?
Cash flow. Revenue and profit margins are important, but cash flow is survival. A business can be profitable on paper and still run out of cash. Track your cash position weekly and maintain at least 3 months of operating expenses as a buffer.
How many metrics should I track?
Start with 5–7 core metrics. More than that leads to dashboard overload where nothing gets attention. You can always add more metrics later as specific questions arise. The goal is to have a small set of numbers that tell you the health of your business at a glance.
Do I need different dashboards for different team members?
Yes, ideally. Your marketing team doesn’t need to see accounts payable, and your finance team doesn’t need marketing campaign metrics. Create role-specific views that show each person the 5–7 metrics most relevant to their work. AI tools like Pulse AI can generate these views automatically based on role.
How often should I look at my business dashboard?
Glance at your core metrics daily (takes 2 minutes). Do a deeper review weekly (15–30 minutes). Analyze trends and adjust strategy monthly (1–2 hours). The beauty of always-on dashboards is that checking takes seconds — you’re not waiting for a report to be built.