Looking for a Tableau alternative? The top options are Power BI ($10/user/month, best for Microsoft teams), Looker Studio (free, best for Google ecosystem), Metabase (free open-source, best for startups), and Pulse AI (AI-first, best for teams that want answers without learning a BI tool). Each serves a different need — from cost savings to simplicity to specific ecosystem integration.
Tableau is powerful, but it’s expensive ($75/user/month for Creator licenses), has a steep learning curve, and requires dedicated analysts to get value from it. Whether you’re looking for something cheaper, easier, open-source, or fundamentally different in approach — this guide covers the best alternatives across every category.
Quick Comparison: Top 10 Tableau Alternatives
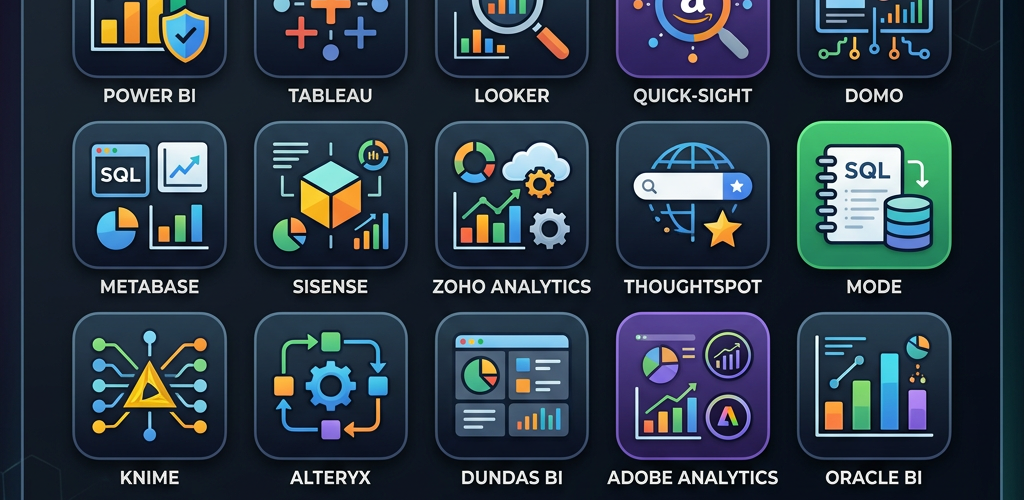
| Tool | Best For | Price | Learning Curve | AI Features |
|---|---|---|---|---|
| Pulse AI | Teams wanting AI-first analytics | Free tier, paid plans available | None — plain English | Core product |
| Power BI | Microsoft-heavy organizations | $10/user/month | Moderate | Copilot integration |
| Looker Studio | Google ecosystem teams | Free | Low-moderate | Basic |
| Metabase | Startups, developers | Free (open-source) | Low | Basic Q&A |
| Apache Superset | Technical teams, self-hosted | Free (open-source) | Moderate-high | Minimal |
| Qlik Sense | Enterprise associative analytics | ~$30/user/month | Moderate | AI assistant |
| Sisense | Embedded analytics | Custom pricing | Moderate | AI-powered |
| Grafana | DevOps, infrastructure monitoring | Free (open-source) | Moderate | Alerting |
| Redash | SQL-first teams | Free (open-source) | Moderate (needs SQL) | Minimal |
| ThoughtSpot | Search-driven analytics | Custom pricing | Low | Search-first AI |
2. Microsoft Power BI — Best for Microsoft Teams
Why consider it: If your organization runs on Microsoft 365, Power BI is the obvious first alternative. It integrates directly into Teams, SharePoint, and Excel — putting dashboards where people already work.
Key advantages over Tableau:
– 7x cheaper ($10/user/month vs $75/user/month for comparable licenses)
– Native Microsoft 365 integration — embed dashboards in Teams channels
– More data connectors (150+ vs Tableau’s 90+)
– Copilot AI for natural language report generation
– Free desktop version for individual use
Key limitations:
– DAX formula language has a steep learning curve for advanced calculations
– Visualization flexibility doesn’t match Tableau’s for complex, custom charts
– Performance can struggle with very large datasets without Premium capacity
– Governance and version control aren’t as mature as Tableau Server
Best for: Organizations already invested in the Microsoft ecosystem that want solid BI at a fraction of Tableau’s cost. Especially strong when most users are dashboard consumers rather than builders.
Pricing: Free (Desktop), $10/user/month (Pro), $20/user/month (Premium Per User).
3. Looker Studio (Google Data Studio) — Best Free Option for Google Users
Why consider it: Completely free. If your data lives in Google Analytics, Google Ads, BigQuery, or Google Sheets, Looker Studio connects natively and builds shareable dashboards at zero cost.
Key advantages over Tableau:
– Entirely free — no user limits, no feature gates
– Direct integration with Google’s marketing and analytics stack
– Simple enough for marketing teams to self-serve
– Real-time collaboration (like Google Docs)
– Community connectors extend data source options
Key limitations:
– Visualization options are basic compared to Tableau
– Limited data transformation capabilities — you need to prep data elsewhere
– Performance degrades with complex reports or large datasets
– No desktop application — browser-only
– Limited calculated fields and no real scripting language
Best for: Marketing teams that primarily work with Google data (Analytics, Ads, Search Console) and need free, shareable dashboards. Not suitable for complex enterprise analytics.
Pricing: Free.
4. Metabase — Best Open-Source Alternative for Startups
Why consider it: Metabase is open-source, self-hostable, and genuinely easy to use. It’s designed for teams that want to explore data without writing SQL (though SQL users love it too). The interface is cleaner and simpler than Tableau’s — you can build useful dashboards on day one.
Key advantages over Tableau:
– Free and open-source (Community Edition)
– Remarkably simple — non-technical users can query data through a visual interface
– Built-in question builder that translates clicks into SQL
– Self-hosted option gives full data control
– Active community and regular updates
Key limitations:
– Visualization options are limited compared to Tableau
– Doesn’t handle very large datasets well without optimization
– Enterprise features (row-level security, SSO, audit logs) require paid plans
– Smaller ecosystem — fewer integrations and community templates
– Not designed for the kind of deep exploratory analysis Tableau enables
Best for: Startups and small-to-medium teams that need a simple, free way to build dashboards and let non-technical users explore data. Particularly popular with product teams.
Pricing: Free (open-source), Pro from $85/month (for 5 users), Enterprise pricing custom.
5. Apache Superset — Best for Technical Teams Who Want Full Control
Why consider it: Apache Superset is a free, open-source BI platform backed by the Apache Software Foundation. It’s highly customizable, handles large datasets well (built on top of SQL), and gives technical teams complete control over their analytics stack.
Key advantages over Tableau:
– Free and open-source — no licensing costs
– Excellent SQL IDE built in
– Handles large datasets efficiently through database-level computation
– Highly extensible — custom visualizations, plugins, API access
– Active open-source community with corporate backing (originally from Airbnb)
Key limitations:
– Requires technical setup — you need someone comfortable with Docker, Python, and database administration
– Not designed for non-technical users — the interface assumes SQL knowledge
– Documentation can be inconsistent
– No native data transformation layer — you need dbt or similar tools
– Visualization polish doesn’t match Tableau or Power BI
Best for: Engineering and data teams that want a free, self-hosted BI platform with strong SQL support and full customizability. Not suitable for business-user self-service.
Pricing: Free (open-source). Preset.io offers a managed cloud version starting at custom pricing.
6. Qlik Sense — Best for Associative Data Exploration
Why consider it: Qlik Sense’s “associative engine” lets users explore data relationships that traditional BI tools miss. Instead of pre-defined queries, Qlik dynamically highlights related data across all fields when you click on any value. This is uniquely powerful for discovery-driven analysis.
Key advantages over Tableau:
– Associative engine reveals hidden data relationships
– Strong data integration and transformation (Qlik Data Integration)
– Good balance of self-service and governed analytics
– Active AI features (Insight Advisor)
– Handles complex data models well
Key limitations:
– Pricing is opaque and can get expensive at scale
– Smaller community and marketplace than Tableau or Power BI
– Interface has a steeper learning curve than Power BI
– Fewer native data connectors than competitors
Best for: Mid-to-large enterprises that need discovery-driven analytics and have complex data relationships across many sources.
Pricing: ~$30/user/month, enterprise pricing varies.
7. Sisense — Best for Embedded Analytics
Why consider it: If you need to embed analytics into your own product (a SaaS application, customer portal, or internal tool), Sisense is built for it. While Tableau and Power BI offer embedding, Sisense treats it as a core use case with better APIs, customization, and white-labeling.
Key advantages over Tableau:
– Purpose-built for embedded analytics
– Strong API and SDK for deep product integration
– In-Chip technology handles large datasets efficiently
– Good AI features (Sisense Fusion)
– White-label capabilities for customer-facing analytics
Key limitations:
– Pricing is custom and can be expensive
– Less suitable for ad-hoc exploration compared to Tableau
– Smaller community and ecosystem
– Learning curve for the embedding/development features
Best for: SaaS companies and product teams that need to embed analytics directly into their applications.
Pricing: Custom — contact sales.
8. Grafana — Best for DevOps and Infrastructure Monitoring
Why consider it: Grafana is the standard for monitoring time-series data — server metrics, application performance, IoT sensors, infrastructure health. It’s free, open-source, and integrates with every monitoring stack (Prometheus, InfluxDB, Elasticsearch, CloudWatch, and more).
Key advantages over Tableau:
– Free and open-source
– Unmatched for real-time monitoring and time-series data
– 150+ data source plugins
– Powerful alerting system
– Massive community and plugin ecosystem
Key limitations:
– Not designed for business analytics or standard BI use cases
– Limited for non-time-series data
– Dashboard building requires understanding of queries and data sources
– Not suitable for non-technical business users
Best for: DevOps, SRE, and engineering teams that need real-time infrastructure monitoring. Not a general-purpose Tableau replacement.
Pricing: Free (open-source), Grafana Cloud free tier available, Pro from $29/month.
9. Redash — Best for SQL-First Teams
Why consider it: Redash is simple: write a SQL query, get a visualization. No drag-and-drop, no formula languages, no complex interface. If your team thinks in SQL, Redash gets out of the way and lets you build dashboards from queries directly.
Key advantages over Tableau:
– Free and open-source
– SQL-native — no new query language to learn
– Connects to 35+ data sources
– Clean, minimal interface
– Easy to self-host
Key limitations:
– Requires SQL knowledge — not for non-technical users
– Limited visualization options
– Development has slowed since Databricks acquisition
– No advanced analytics or AI features
– Doesn’t scale well for large organizations
Best for: Small technical teams that want a lightweight, SQL-first dashboarding tool without the complexity of enterprise BI platforms.
Pricing: Free (open-source).
10. ThoughtSpot — Best for Search-Driven Analytics
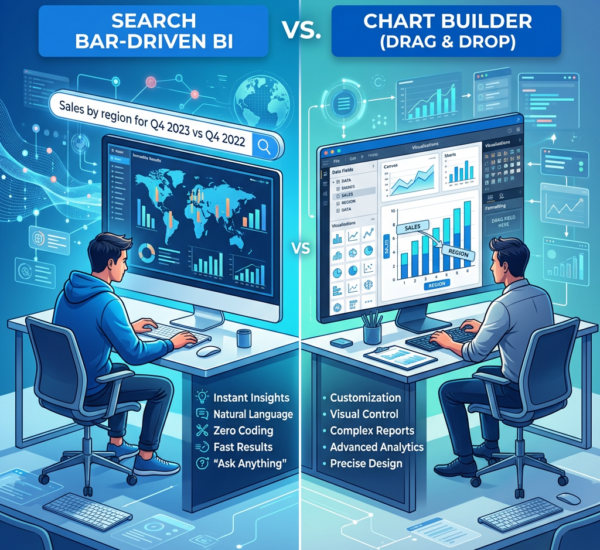
Why consider it: ThoughtSpot pioneered the “search your data” approach — type a question in a search bar and get a chart. It’s the closest traditional BI tool to an AI-first experience, though it still requires significant data modeling setup.
Key advantages over Tableau:
– Natural language search interface
– AI-driven automated insights (SpotIQ)
– Good for business user self-service
– Strong enterprise governance features
– Liveboard collaboration
Key limitations:
– Expensive — enterprise pricing only
– Requires significant data modeling and setup before the search works well
– Less visualization flexibility than Tableau
– Smaller community and ecosystem
Best for: Large enterprises that want to enable self-service analytics through search, with budget for enterprise licensing and implementation.
Pricing: Custom — contact sales.
How to Choose the Right Tableau Alternative
If cost is the main driver: Power BI ($10/user), Looker Studio (free), or Metabase (free open-source).
If you want the simplest option: Pulse AI (no learning curve) or Metabase (minimal learning curve).
If you’re in the Microsoft ecosystem: Power BI — the integration alone is worth it.
If you’re in the Google ecosystem: Looker Studio — free and natively connected.
If you need open-source, self-hosted: Metabase, Apache Superset, or Grafana.
If you want AI-first analytics: Pulse AI — built around AI from day one, not AI bolted onto a manual tool.
If you need embedded analytics: Sisense or Pulse AI.
If you need real-time monitoring: Grafana.
The BI market has fragmented beyond the “Tableau vs Power BI” binary. The right choice depends on your team’s technical level, budget, existing tech stack, and whether you want a traditional BI tool or an AI-first analytics platform.
Frequently Asked Questions
Is there a free version of Tableau?
Tableau Public is free but requires publishing all dashboards publicly — there’s no way to keep data private. Tableau Desktop does not have a free tier. For genuinely free private analytics, consider Power BI Desktop, Looker Studio, Metabase, or Apache Superset.
What’s the easiest Tableau alternative to learn?
Pulse AI has no learning curve at all — you type questions in plain English. Among traditional BI tools, Metabase is the easiest to pick up, followed by Looker Studio. Power BI is easier than Tableau but still requires learning DAX for advanced work.
Can I migrate my Tableau dashboards to another tool?
Not easily. Tableau uses proprietary formats (.twb, .twbx) that don’t export to other platforms. You’ll need to rebuild dashboards in the new tool. The data connections and underlying data can transfer, but the visualizations themselves need to be recreated. This is a significant switching cost — factor it into your decision.
Which Tableau alternative has the best AI features?
Pulse AI is built entirely around AI — it’s the core interface, not an add-on. Among traditional BI tools, Power BI’s Copilot integration and ThoughtSpot’s search-driven approach are the strongest AI implementations. Tableau’s own Einstein AI is competitive but requires Salesforce ecosystem integration.
Do any Tableau alternatives support the same level of data governance?
Power BI and Qlik Sense offer enterprise-grade governance features comparable to Tableau Server — row-level security, audit logs, certification workflows, and sensitivity labels. Open-source tools (Metabase, Superset) have more limited governance features, though Metabase’s Enterprise edition adds most enterprise controls.