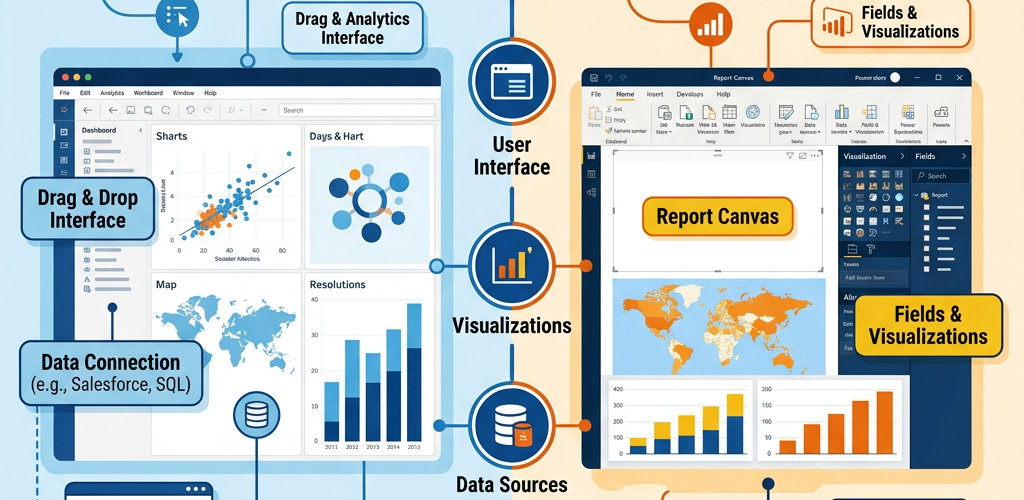
Tableau excels at advanced data visualization and exploratory analytics. Power BI wins on affordability and Microsoft ecosystem integration. Tableau starts at $75/user/month (Creator license); Power BI Pro starts at $10/user/month. Both are Gartner Magic Quadrant leaders, but they serve different users — Tableau for data analysts who need deep visual exploration, Power BI for teams already embedded in Microsoft 365.
This guide compares them across 10 dimensions so you can make an informed decision — and we’ll show you a third option that eliminates the tradeoffs entirely.
Quick Comparison Table
| Feature | Tableau | Power BI | Pulse AI |
|---|---|---|---|
| Starting price | $75/user/month (Creator) | $10/user/month (Pro) | Free tier available |
| Learning curve | Steep — weeks to proficiency | Moderate — days if you know Excel | None — type questions in plain English |
| Best visualizations | Industry-leading, highly customizable | Good, improving rapidly | AI-generated, automatically optimized |
| Data connections | 90+ native connectors | 150+ native connectors | Connects to databases, spreadsheets, APIs |
| Collaboration | Tableau Server/Cloud (separate cost) | Built into Microsoft 365 | Built-in sharing and live dashboards |
| AI/ML features | Ask Data, Einstein Discovery | Copilot, Q&A, AutoML | Core product — everything is AI-first |
| Mobile experience | Dedicated mobile app | Power BI Mobile app | Responsive web — works on any device |
| Best for | Data analysts, large enterprises | Microsoft-heavy organizations | Anyone who wants answers without learning a tool |
| Setup time | Days to weeks | Hours to days | Minutes |
| Governance | Tableau Server with full admin controls | Power BI admin portal, sensitivity labels | Role-based access, audit logs |
Pricing: Power BI Is Significantly Cheaper
This is where the conversation usually starts — and where Power BI has a massive advantage.
Tableau pricing (per user, per month):
– Viewer: $15/user/month — can view and interact with dashboards, but can’t create anything
– Explorer: $42/user/month — can edit existing workbooks and do limited exploration
– Creator: $75/user/month — full authoring, data prep, and publishing capabilities
Plus, if you want on-premise deployment, Tableau Server requires a separate infrastructure investment. Tableau Cloud handles hosting but still charges per-user.
Power BI pricing (per user, per month):
– Power BI Pro: $10/user/month — full creation, sharing, and collaboration (included in Microsoft 365 E5)
– Power BI Premium Per User: $20/user/month — adds paginated reports, deployment pipelines, AI features
– Power BI Premium Per Capacity: Starting ~$4,995/month — dedicated cloud capacity for large-scale deployments
The math is stark. A 50-person analytics team on Tableau Creator costs $45,000/year. The same team on Power BI Pro costs $6,000/year. Even with Power BI Premium Per User, it’s $12,000/year — still a fraction of Tableau’s cost.
Power BI also has a free tier (Power BI Desktop) that lets individual users build reports locally. There’s no free equivalent in Tableau — Tableau Public exists but requires publishing dashboards publicly.
Data Visualization: Tableau Still Leads
If pure visualization quality is your priority, Tableau remains the gold standard.
Tableau’s strengths: Drag-and-drop visual exploration that’s genuinely intuitive once you learn it. You can create virtually any visualization — from standard bar and line charts to complex geo-spatial maps, Sankey diagrams, custom shapes, and layered dashboards. Tableau’s “VizQL” engine translates every drag action into an optimized query, making exploration feel instant even on large datasets.
Power BI’s strengths: Solid out-of-the-box visuals that cover 90% of business needs. The custom visual marketplace adds hundreds more options. Power BI’s visuals have improved dramatically in recent years — the gap with Tableau has narrowed significantly. For standard business dashboards (KPI cards, bar charts, tables, maps), Power BI is perfectly capable.
Where Tableau pulls ahead: Complex, multi-layered visualizations. If you need to overlay multiple data sources on a geographic map, create calculated fields on the fly during exploration, or build intricate dashboard interactions — Tableau gives you more control. Data analysts who spend all day exploring data consistently prefer Tableau’s interface.
Where Power BI catches up: Pre-built report templates, pixel-perfect paginated reports for formal distribution, and tighter integration with Excel (which most business users already know). For structured, recurring reports that need to look the same every month, Power BI is actually easier.
Ease of Use: Different Kinds of “Easy”
Neither tool is truly easy for a beginner. They’re just hard in different ways.
Tableau has a steeper initial learning curve. The interface is powerful but dense — new users often feel overwhelmed by the shelves, marks cards, and dimension/measure distinction. Once you internalize the mental model (usually 2-4 weeks of regular use), it becomes highly productive. Tableau is “hard to learn, satisfying to master.”
Power BI feels more approachable because it resembles Excel and other Microsoft products. If your team already uses Microsoft 365, the transition is smoother. However, Power BI’s real complexity hides in DAX (its formula language) and Power Query (its data transformation layer). Simple dashboards are quick to build; anything involving complex calculations requires significant DAX knowledge — and DAX has a reputation for being unintuitive.
The honest truth: Both tools require training. Budget 1-2 weeks for basic Power BI proficiency and 3-4 weeks for basic Tableau proficiency. Advanced use of either tool takes months.
Data Connectivity and Preparation
Tableau connects to 90+ data sources natively and offers Tableau Prep for visual data cleaning and transformation. Tableau Prep is a standalone tool (included with Creator licenses) that lets you combine, reshape, and clean data before analysis. It’s powerful but adds another tool to learn.
Power BI connects to 150+ data sources and includes Power Query for data transformation built directly into the report-building interface. Power Query uses a functional language called M under the hood, but most transformations can be done through a point-and-click interface. For Microsoft-specific sources (SQL Server, Azure, Dynamics, SharePoint), Power BI’s integration is seamless.
Edge cases: Tableau handles very large datasets (billions of rows) better through its extracts and live connection optimization. Power BI can struggle with extremely large datasets unless you use Premium capacity or Direct Query mode, which has its own limitations.
AI and Natural Language Features
Both tools have added AI capabilities, but with different approaches.
Tableau’s AI: “Ask Data” lets users type questions in natural language to generate visualizations. Einstein Discovery (from Salesforce) adds predictive analytics and automated insights. Tableau also recently added Tableau Pulse — an AI-powered metrics layer that proactively surfaces insights. These features are useful but still feel bolted-on rather than core to the experience.
Power BI’s AI: Copilot integration lets users describe what they want in natural language to generate reports. Q&A lets users type questions to get answers from their data. AutoML features allow building machine learning models without code. Power BI’s AI features benefit from Microsoft’s massive investment in AI across all products, but they’re still supplementary to the core drag-and-drop interface.
The limitation of both: AI features in Tableau and Power BI are add-ons to fundamentally manual tools. You still need to connect data, build a model, and understand the tool’s interface. The AI assists but doesn’t replace the core workflow.
Collaboration and Sharing
Tableau requires Tableau Server (on-premise) or Tableau Cloud for sharing. Both add cost. Collaboration features include commenting on views, subscription-based alerts, and embedded analytics. The experience is polished but siloed — it doesn’t integrate into where your team already works.
Power BI integrates directly into Microsoft Teams, SharePoint, and the broader Microsoft 365 ecosystem. If your organization runs on Microsoft, Power BI dashboards can live right inside Teams channels where people already collaborate. This is arguably Power BI’s biggest practical advantage — zero friction for sharing.
When to Choose Tableau
Pick Tableau if your team includes dedicated data analysts who need maximum visualization flexibility. If you’re exploring complex datasets, doing advanced statistical analysis, or need publication-quality visualizations that go beyond standard charts, Tableau is the stronger tool. It’s also the better choice if you’re not locked into the Microsoft ecosystem and want a best-of-breed visualization platform.
When to Choose Power BI
Pick Power BI if your organization is built on Microsoft 365 and cost matters. The pricing advantage is enormous, the Teams integration creates natural adoption, and for standard business reporting, Power BI does everything most teams need. It’s also the pragmatic choice for organizations where most users are business professionals (not data analysts) who need to consume dashboards rather than build complex explorations.
Frequently Asked Questions
Can I use Power BI and Tableau together?
Yes, some organizations use both — Tableau for advanced analytics teams and Power BI for broader business reporting. But this creates governance headaches, duplicate infrastructure costs, and inconsistent metrics. Most organizations eventually standardize on one tool. Or they move to an AI-first platform that serves both use cases.
Is Tableau worth 7x the price of Power BI?
For dedicated data analysts who spend 40+ hours a week in the tool, Tableau’s superior exploration capabilities can justify the premium. For organizations where most users just need to view dashboards and run standard reports, Power BI delivers 90% of the value at 15% of the cost. The honest answer depends on how your team actually uses BI.
Which tool is better for real-time data?
Both support live connections to real-time data sources, but both have limitations. Tableau’s live connections can slow down with very complex visualizations. Power BI’s Direct Query mode limits some visualization features. For true real-time dashboards (sub-second updates), both tools often need supplementary streaming solutions.
Do I need training for either tool?
Yes. Tableau offers official certification programs (Tableau Desktop Specialist, Certified Data Analyst) that take weeks to months. Power BI has Microsoft’s PL-300 certification. Both have extensive training ecosystems. Budget for training time and costs — a tool nobody knows how to use delivers zero value regardless of its features.
Which has better AI features in 2025?
Power BI benefits from Microsoft’s Copilot integration across the entire Microsoft 365 suite, giving it a slight edge in AI-powered report generation. Tableau’s Einstein AI (via Salesforce) is strong in predictive analytics. But both tools treat AI as an enhancement to manual workflows — not as the primary interface. If AI-first analytics is the goal, purpose-built platforms like Pulse AI are further ahead.